
1_Introduction
The aim was to compare differences in high-rise building shaping based on climatic conditions and context using Ladybug radiation analysis and Galapagos.
note: we need ladybug and weaverbird plugins for this analysis
2_Context
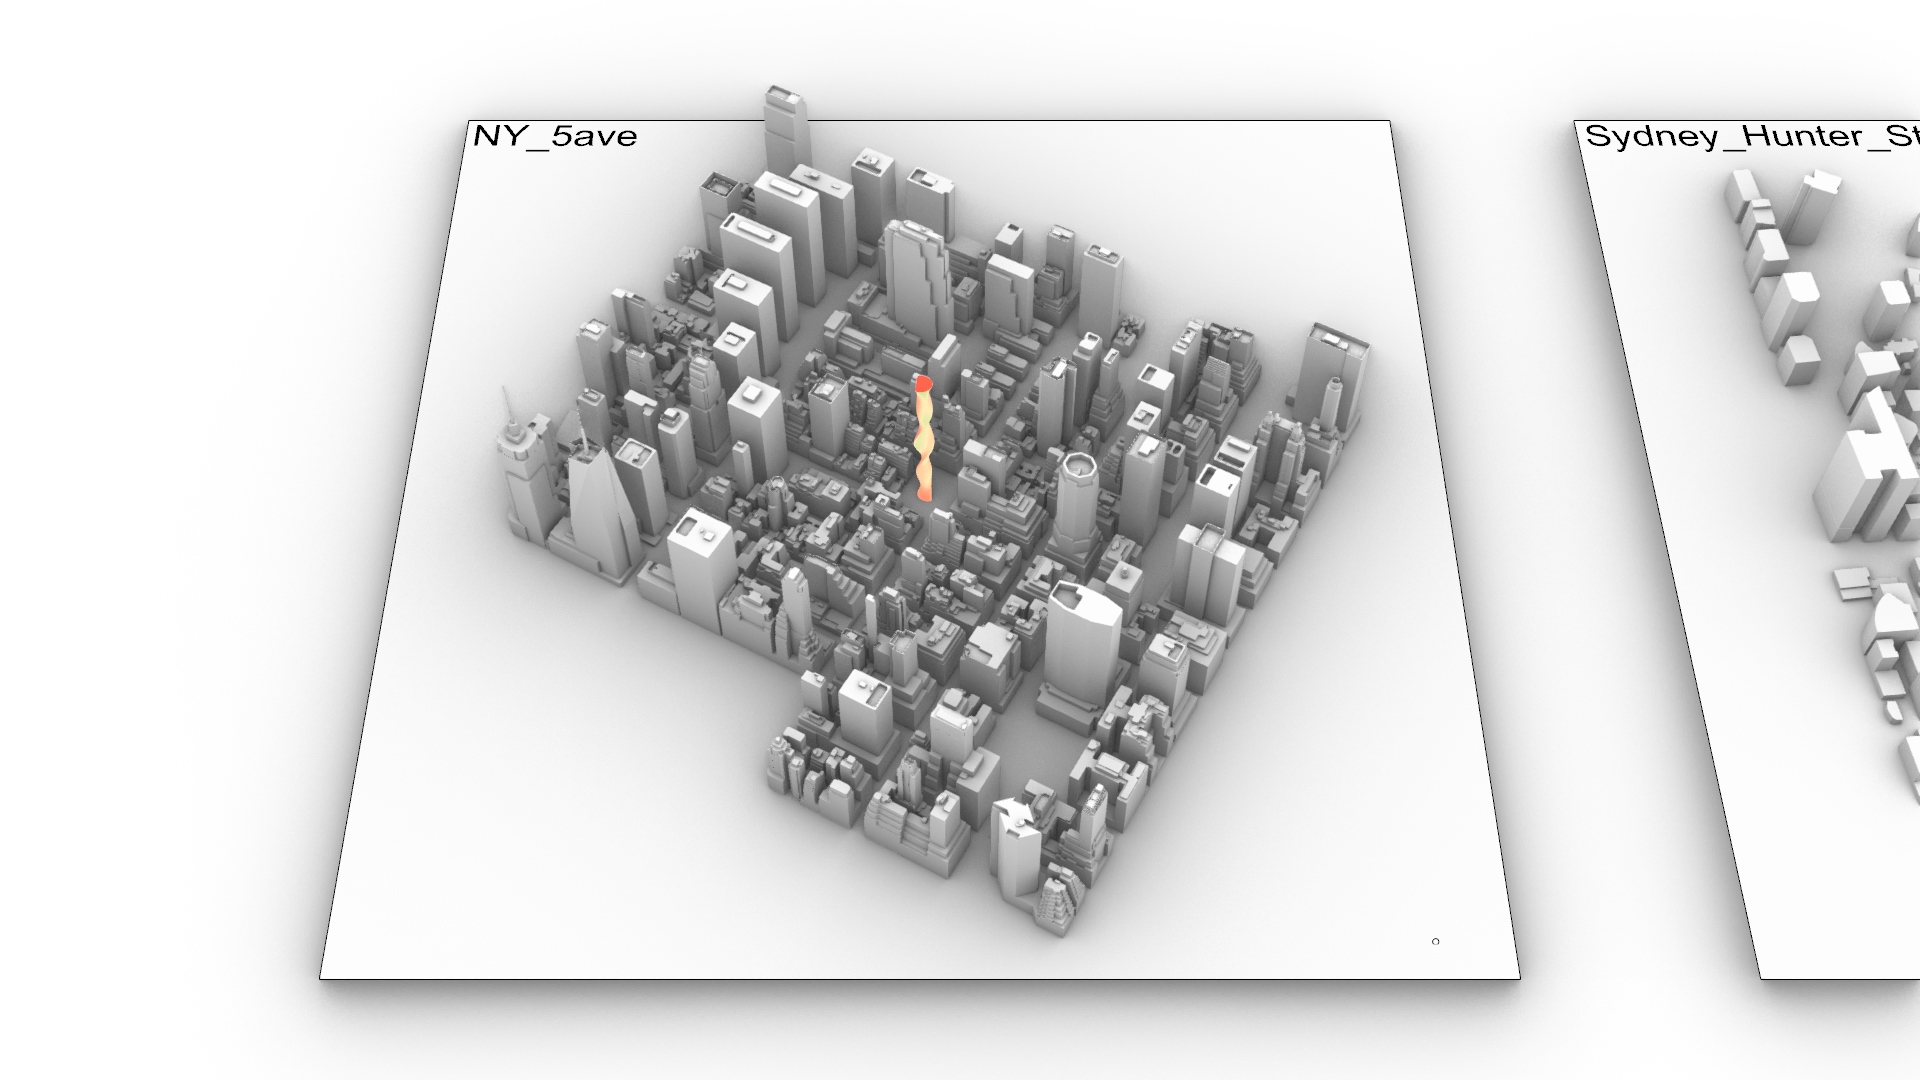
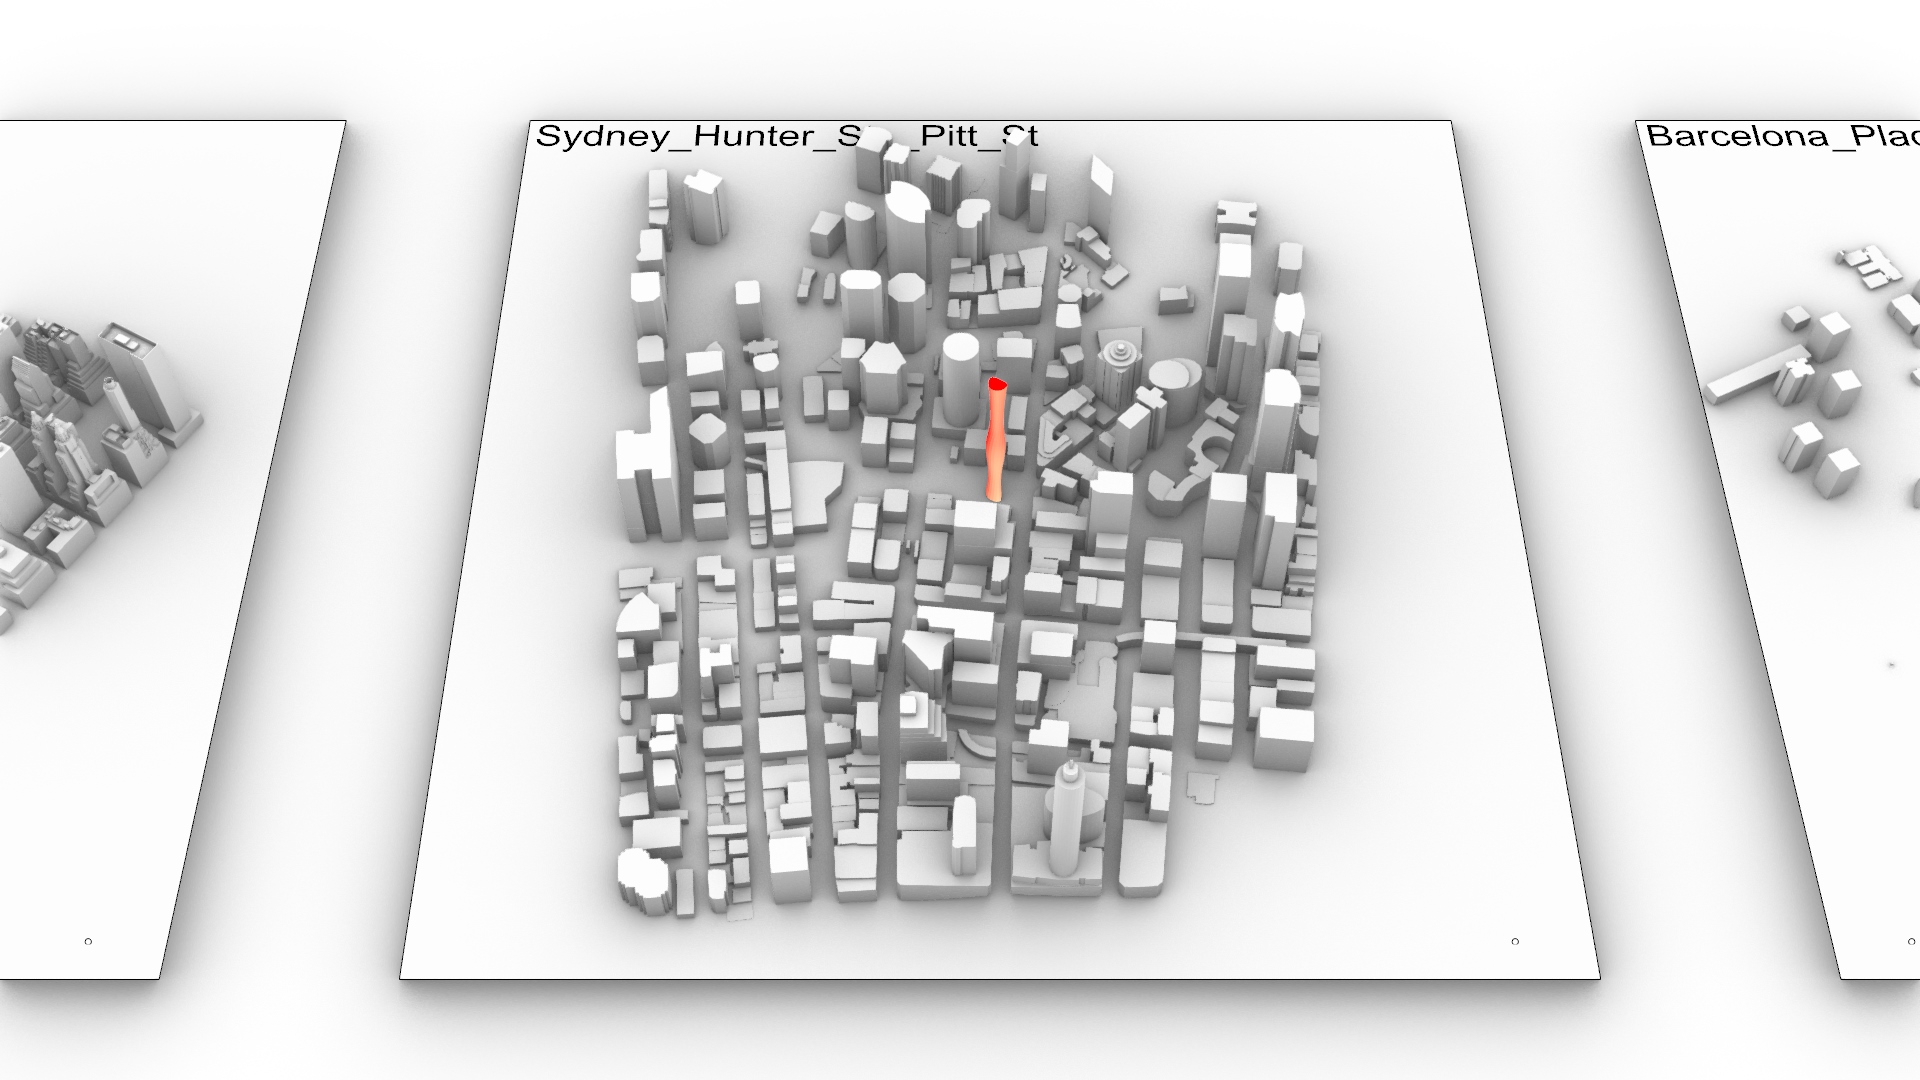
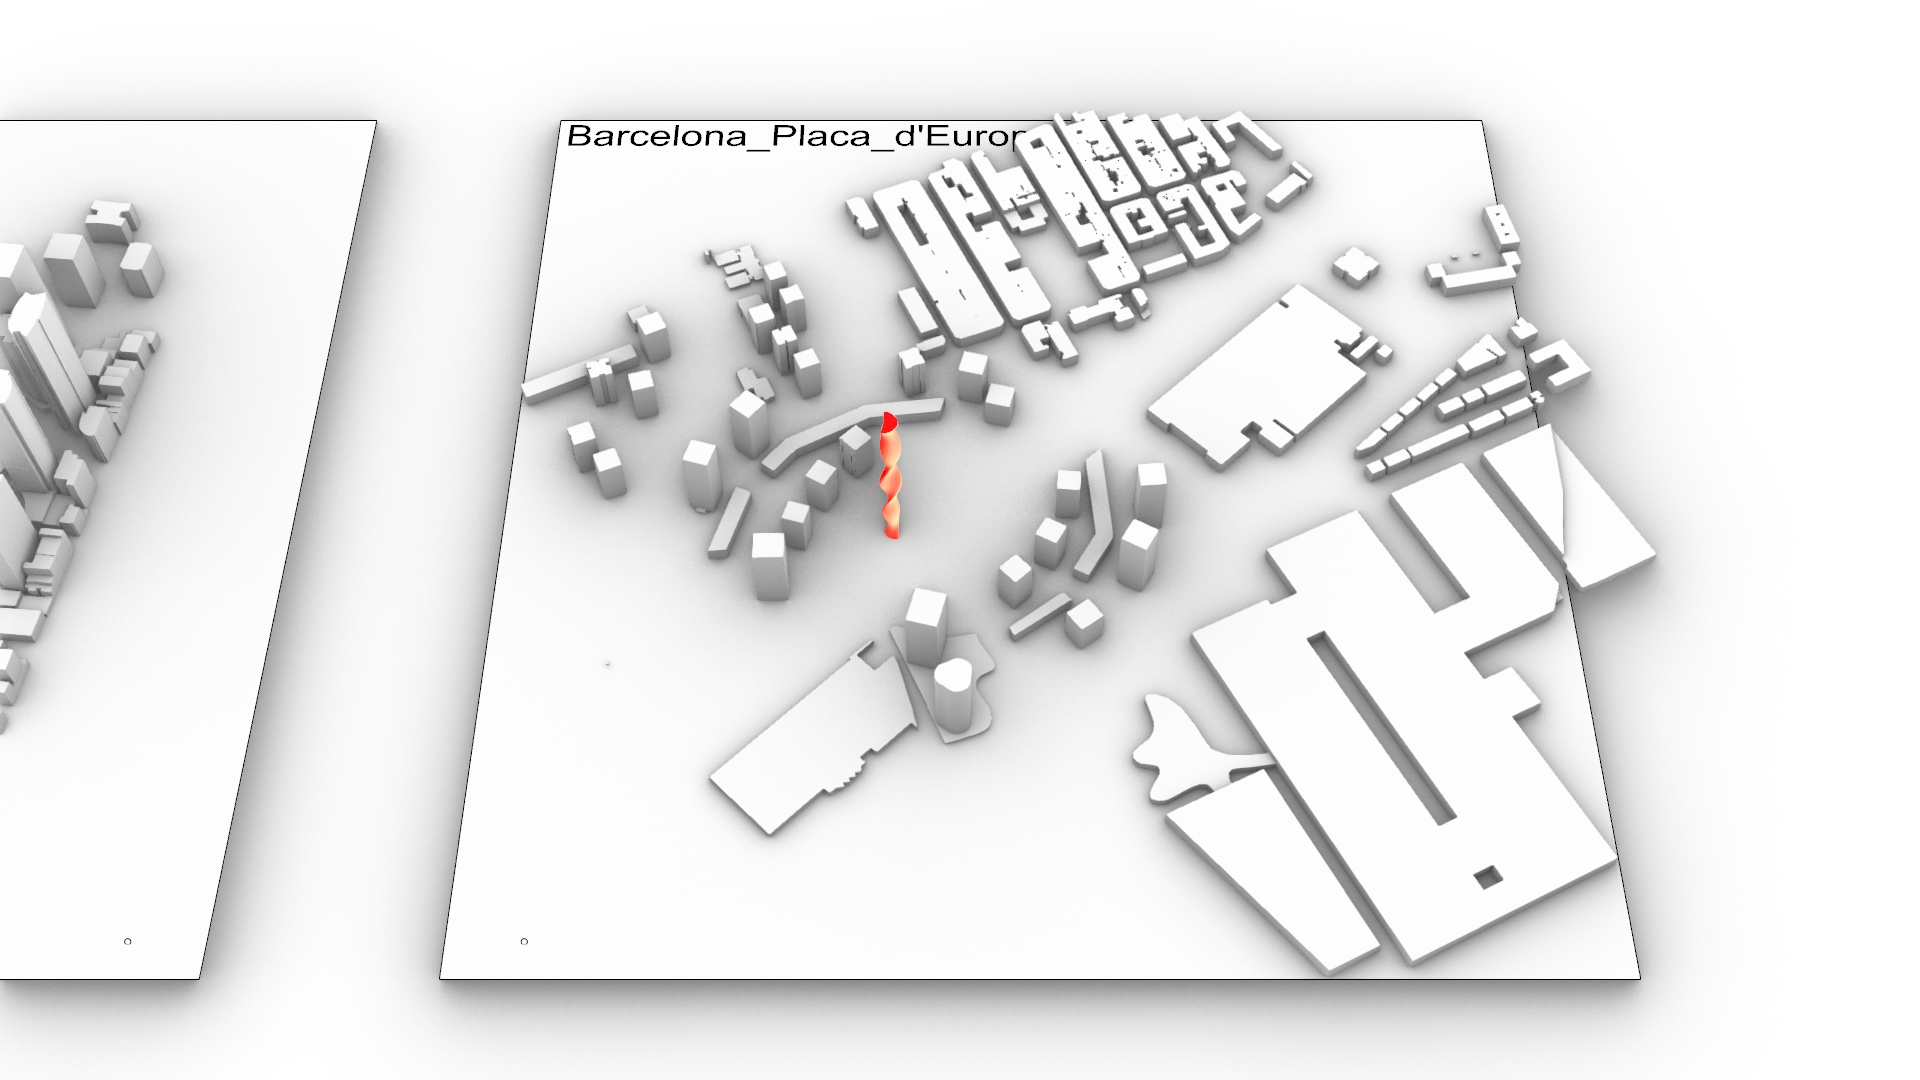
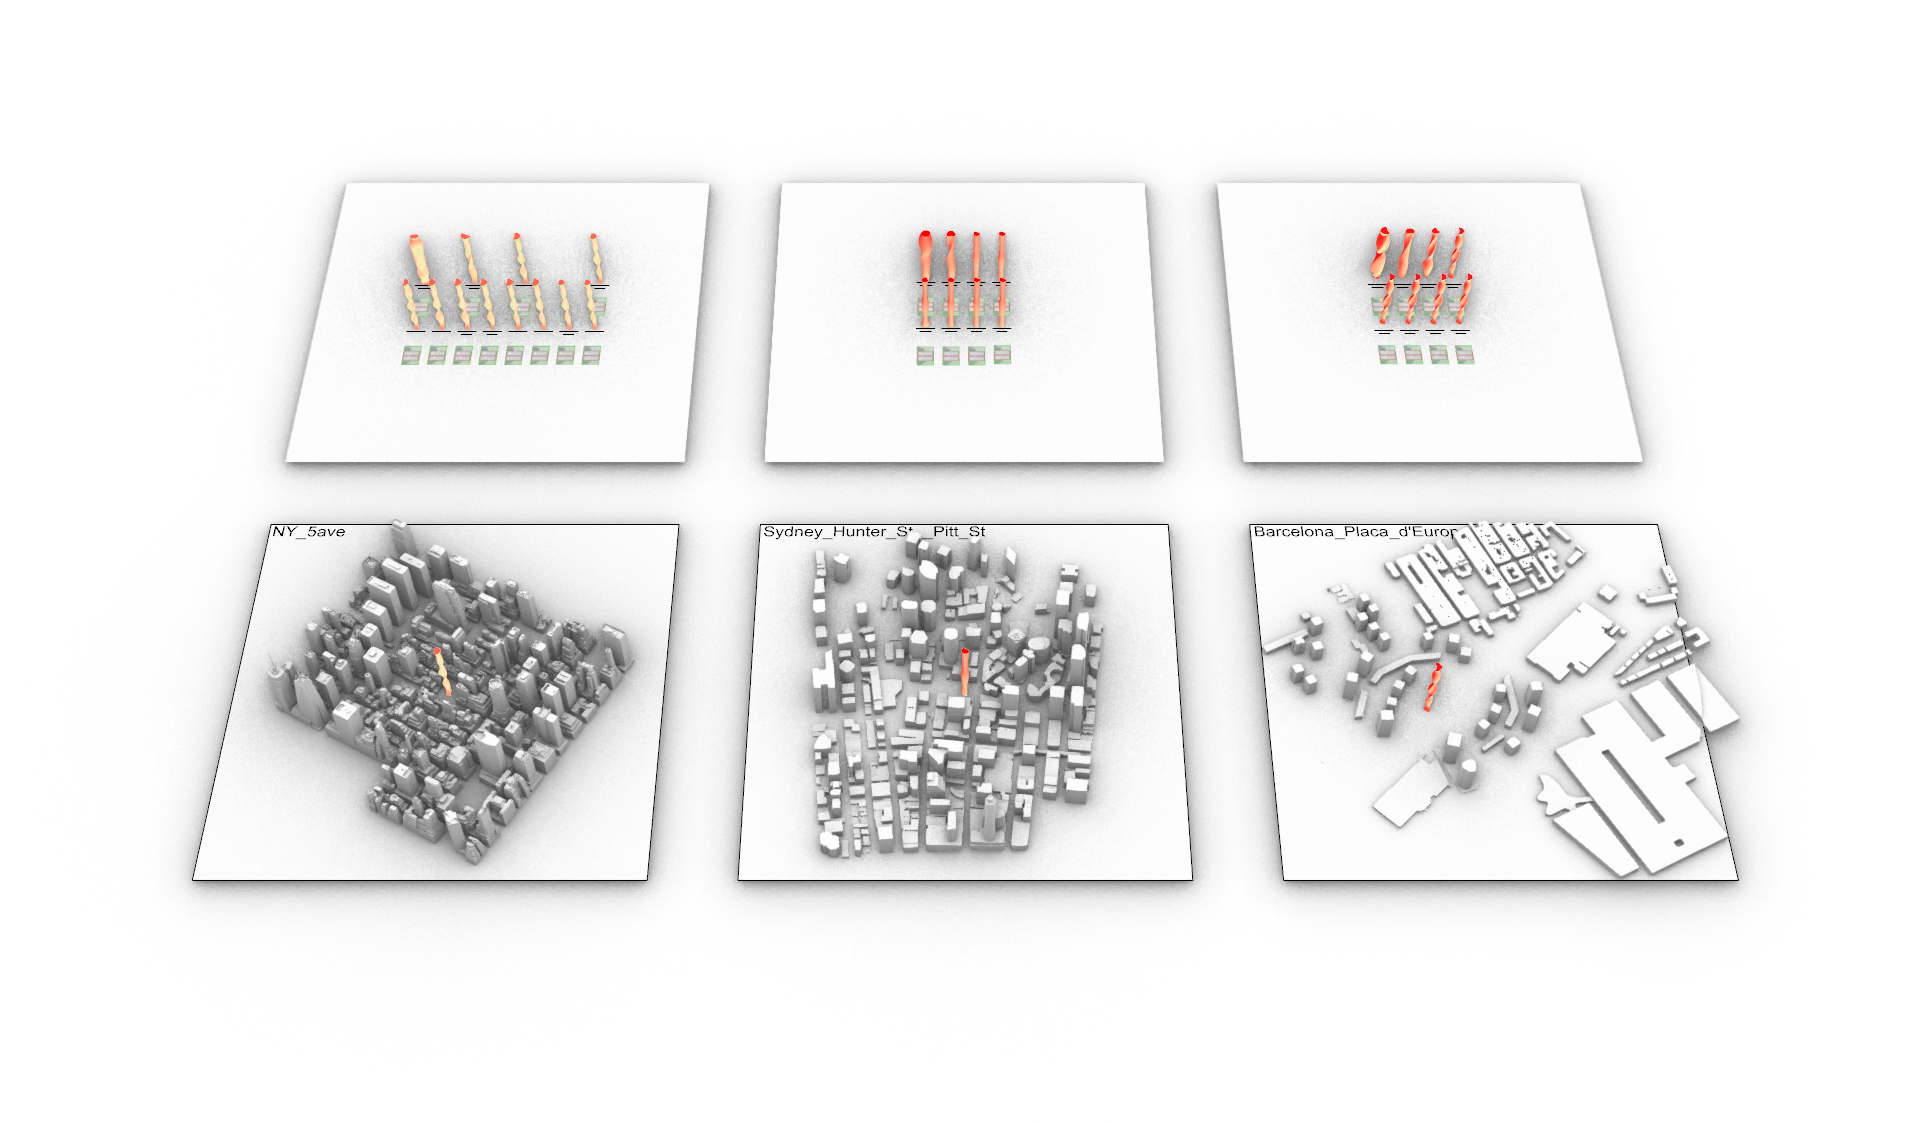
I selected 3 environments for analysis:
For faster analysis it is useful to have the surroundings as one mesh.
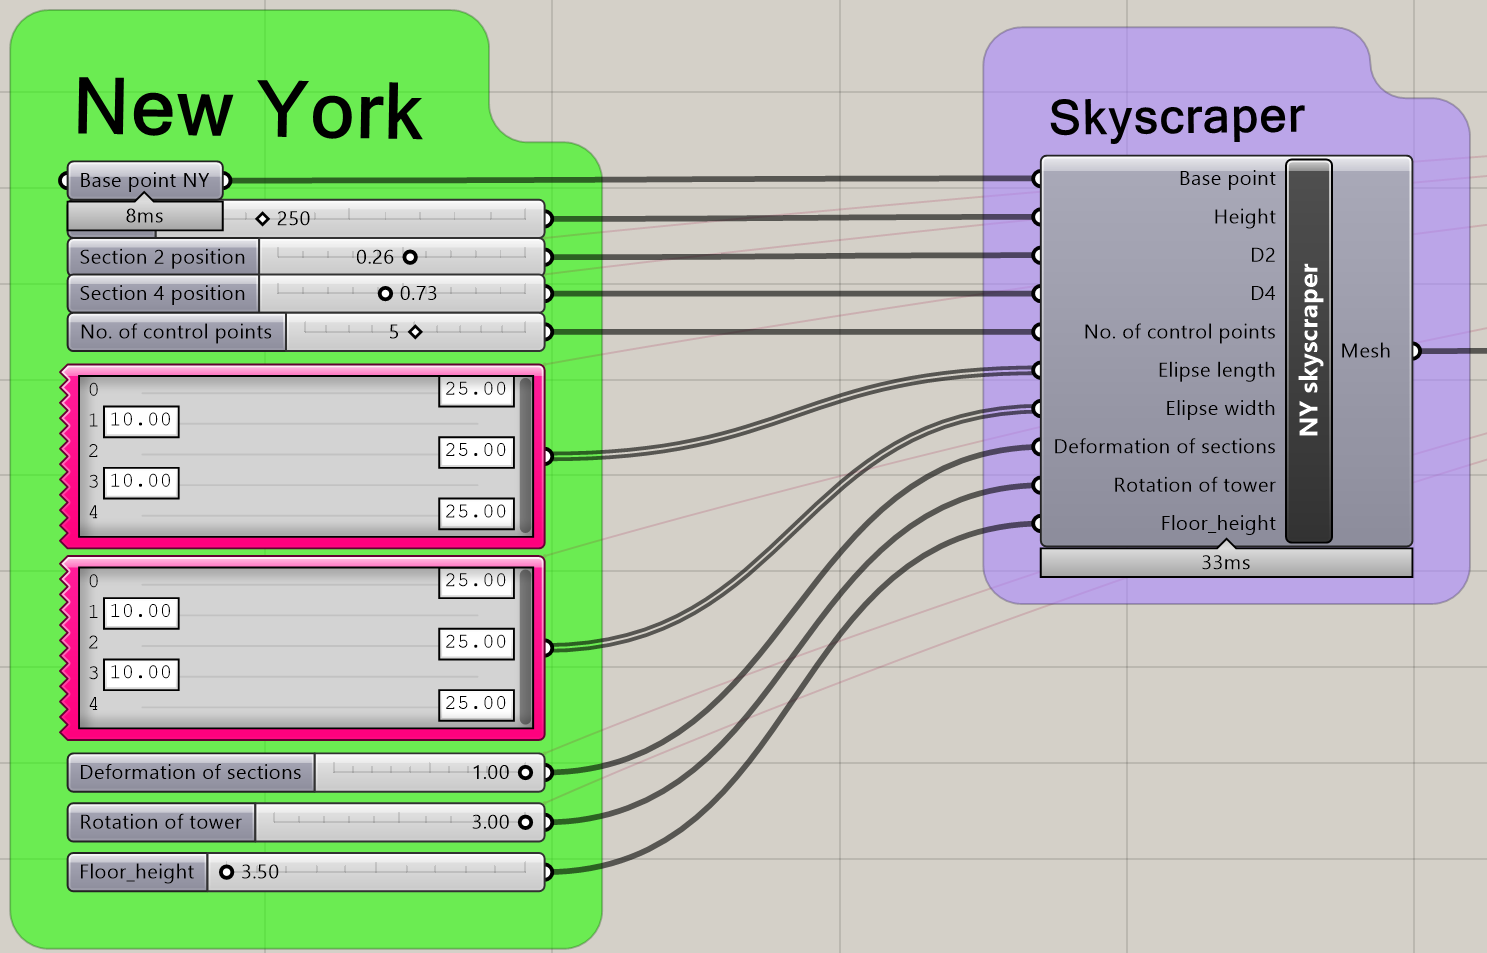
3_Skyscraper
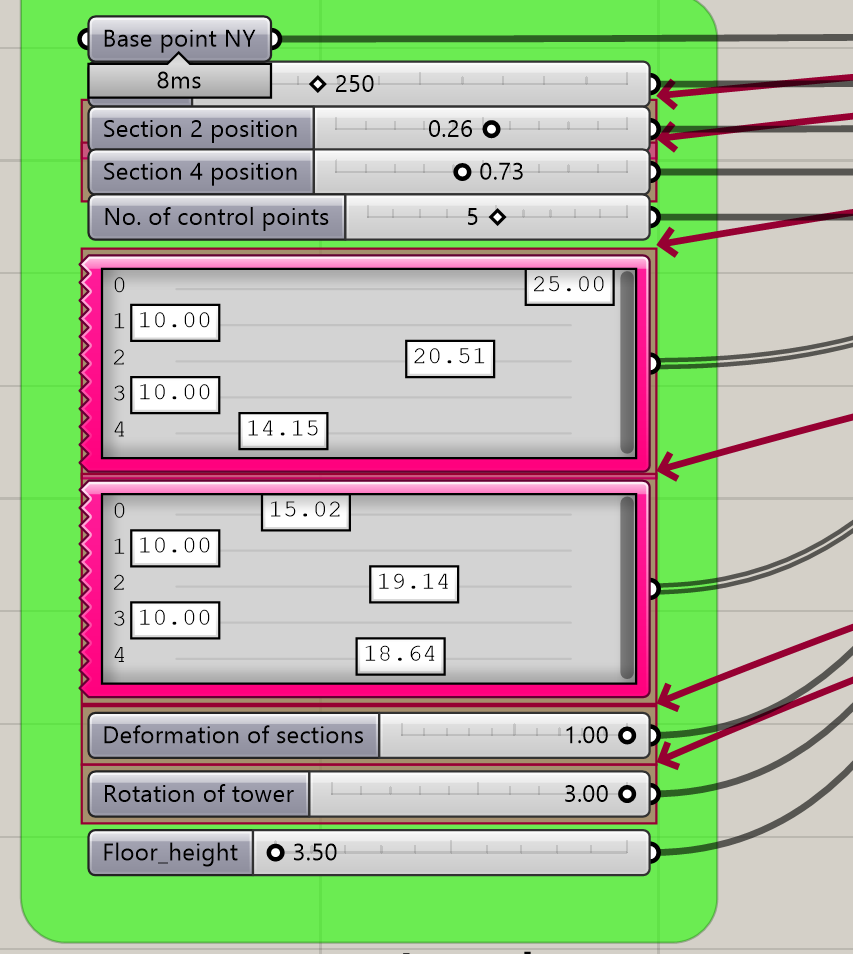
The skyscraper consists of five deformed ellipses. The end and middle ellipses have a fixed height and the second and fourth ellipses have a range in which their height can vary. The profile can be changed by changing the number of control points. Each ellipse has variable dimensions from 10 to 25 m. One of the points of the ellipse can move towards the centre and thus deform the basic shape. The cross sections can rotate between 0 and 3π between the first and last ellipse. We can also determine the height of each floor.
First we have a starting point from which we make a curve of the total height of the skyscraper. We divide this into 5 sections in the required parameters, i.e. 3 fixed and two sliding profiles.
Create 5 ellipses, divide them by the desired number of points and move the point with index 0 in the direction of the starting point of the ellipse.
Create a bounding box around the ellipses and use the remap function to define the deformation distance.
Replace point 0 in the original point sheet and create a new closed profile via interpolation. Using the function average we find the approximate center of the profiles beyond which we orient the curves into sections.
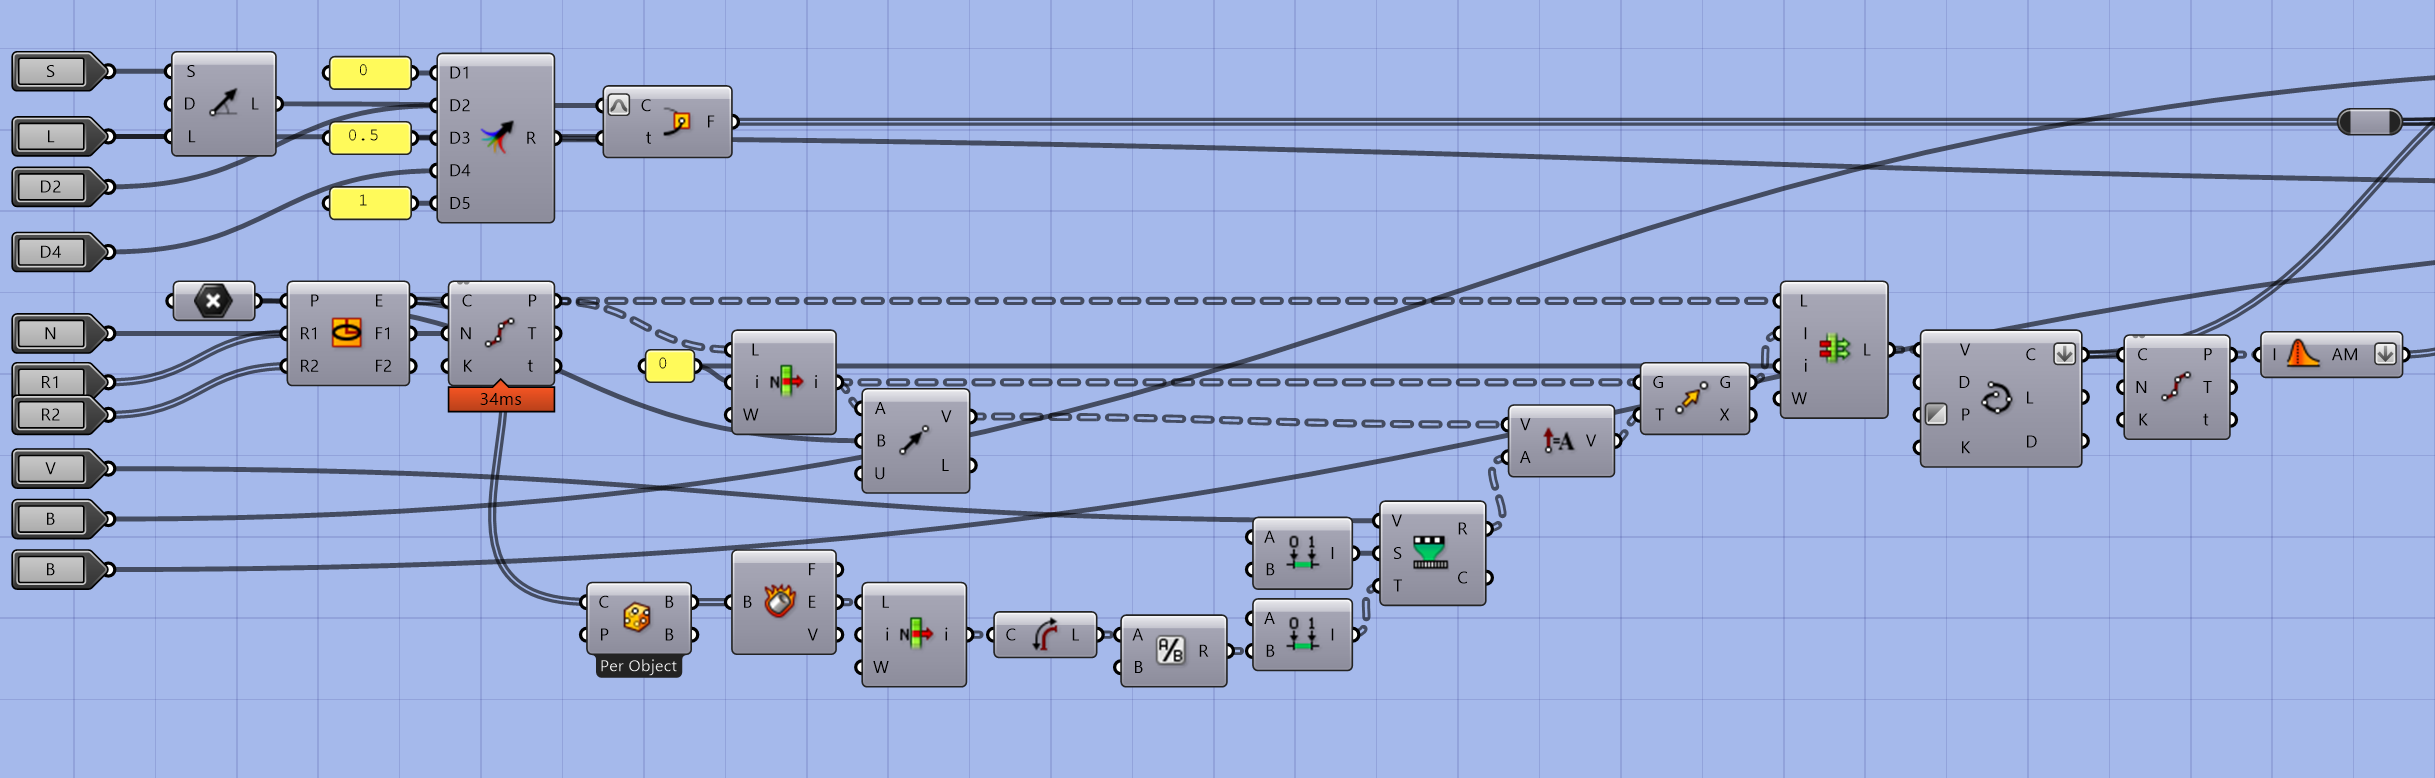
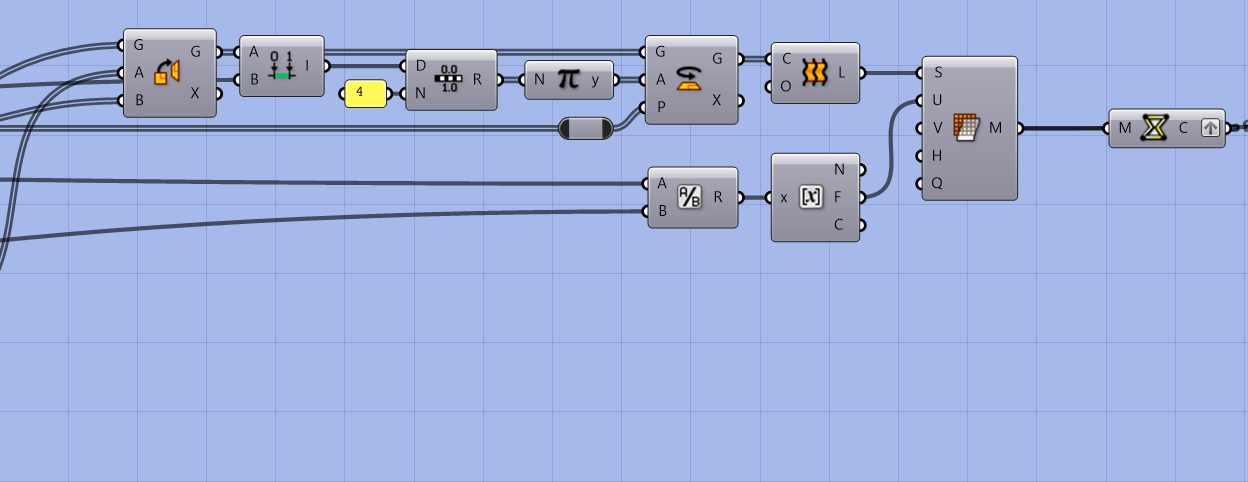
Oriented sections rotate around their own axis. Using the range function, we define individual rotations for each section.
Create a loft from the sections.
Use the mesh surface function to create a mesh from surface.
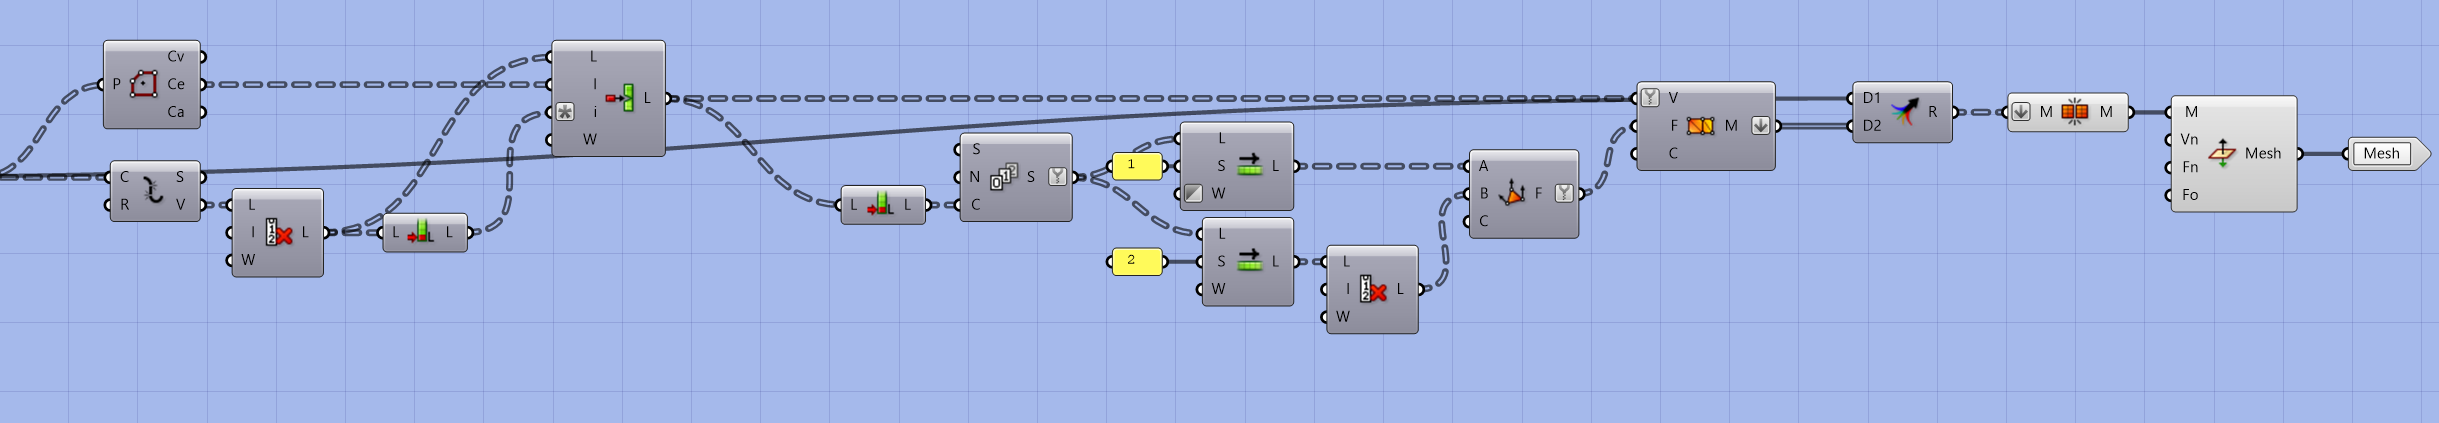
From the Weaverbird plugin, use the naked border function to select the outermost two profiles.
Convert surface to mesh so that we have control over the resulting mesh. Otherwise Ladybug converts the input geometry itself and we have no control over the resulting mesh.
Take the center of the edge profiles and create individual triangles to close the volume of the skyscraper. Use the shift list function to create individual triangles from the point indices (0,1,center 1,2,center…)
Create a mesh from the individual faces and use the mesh join function to join them with the shell into a closed mesh.
Finally, use a flip mesh to correctly orient the normal vectors of the faces.
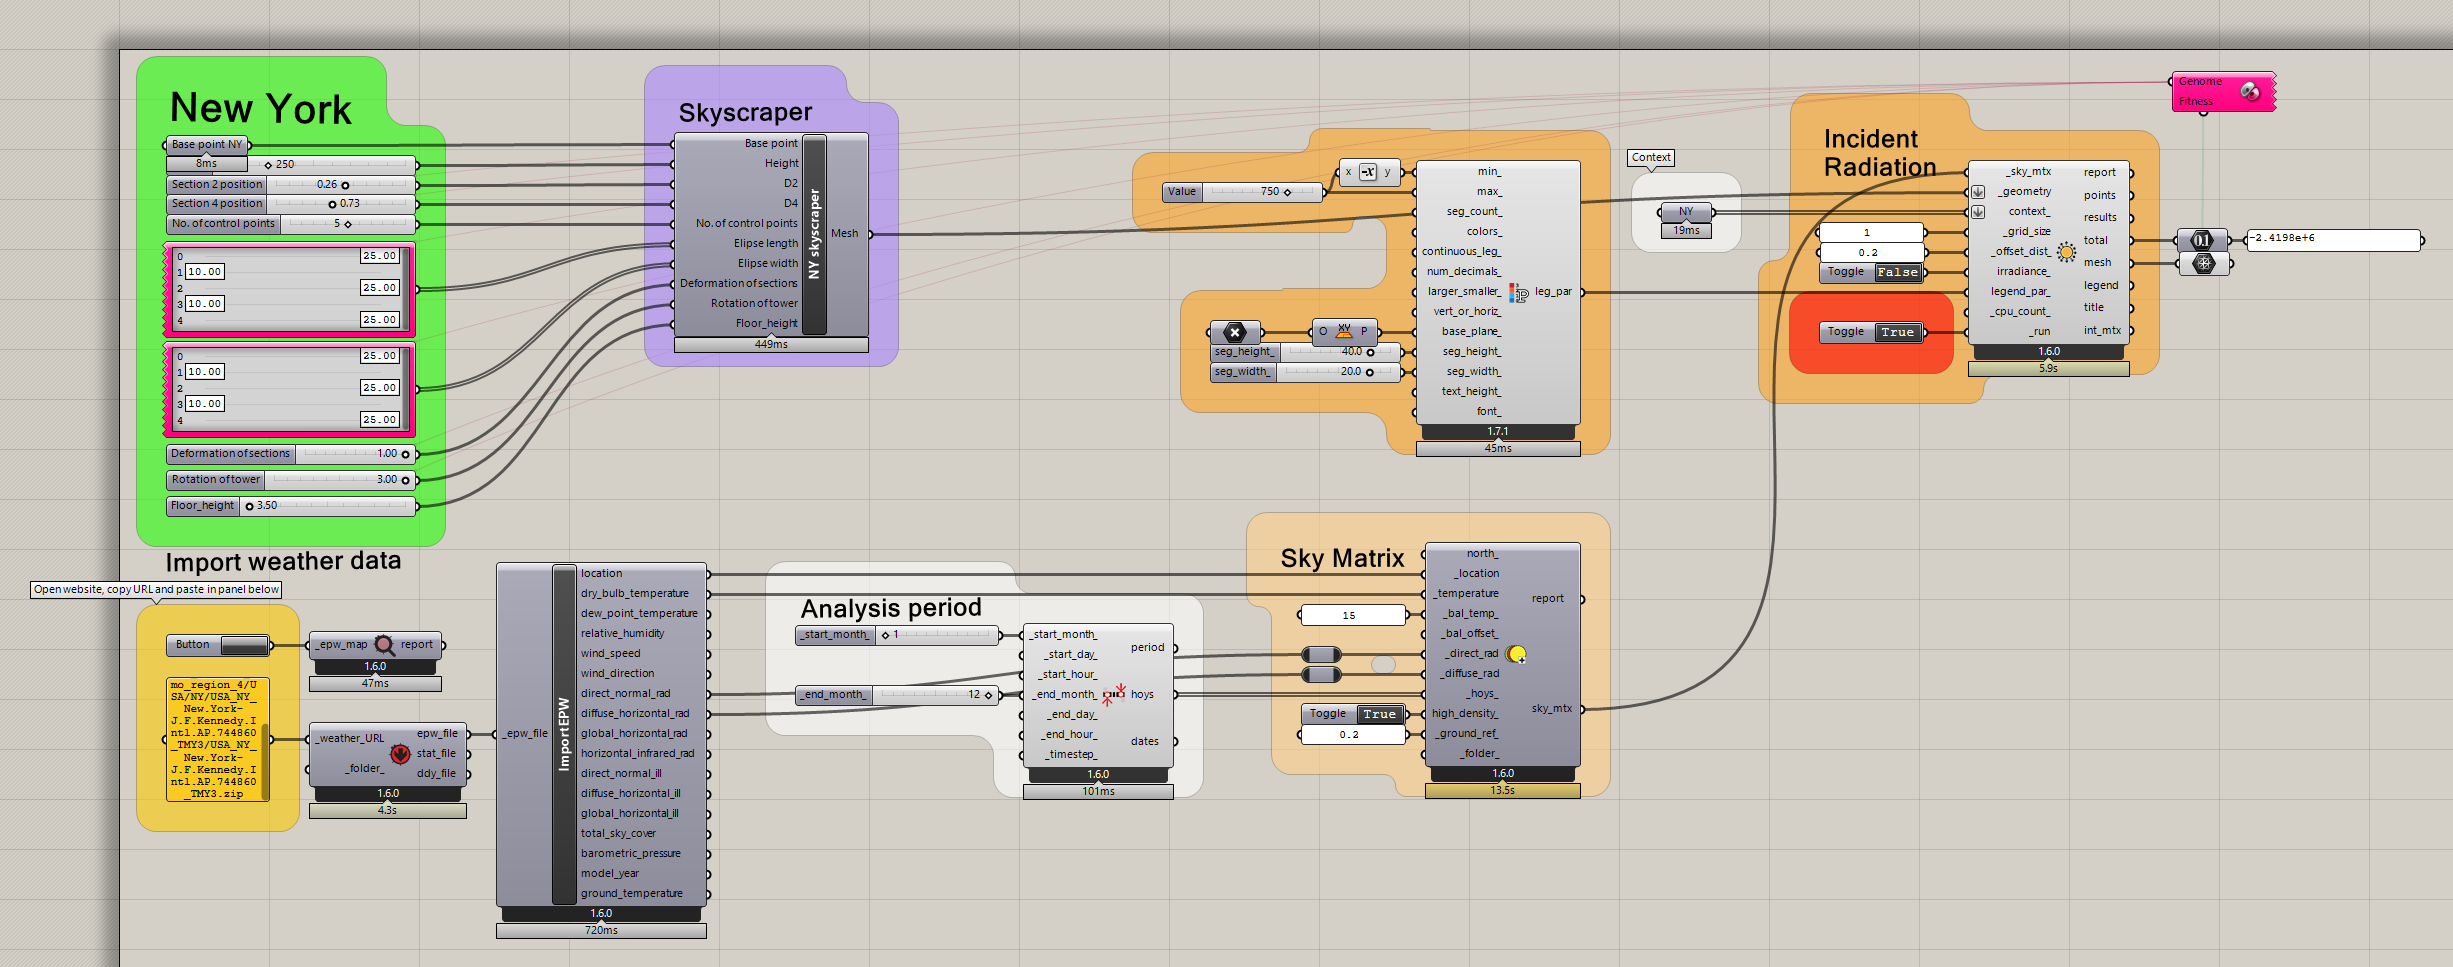
04_Ladybug analysis
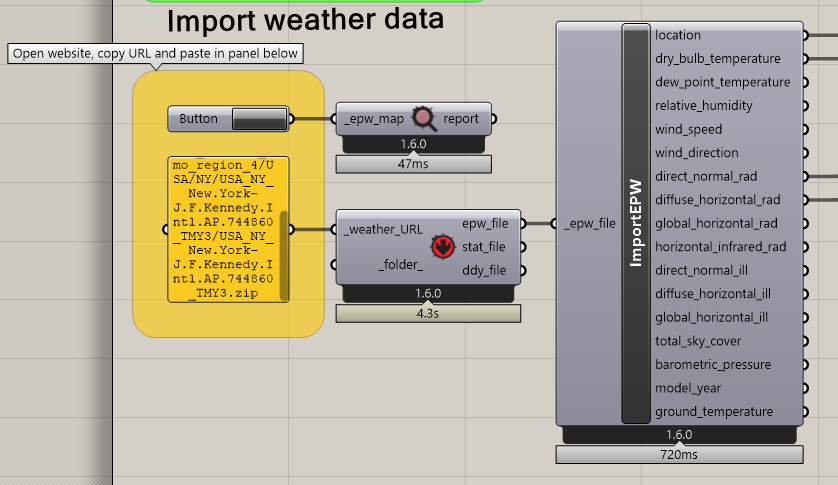
Climate data download
Click on the button and a web page opens where we select the weather data set we need.
Copy the URL into the yellow panel.
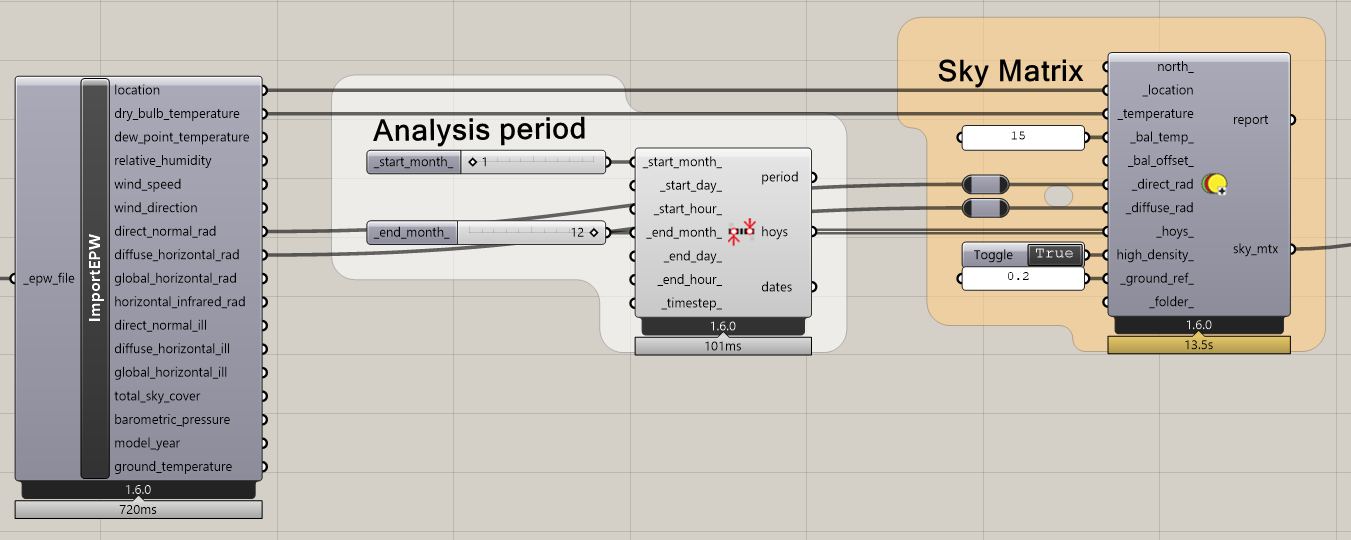
Construct sky matrix
To perform the analysis, we first need the sky matrix. We choose LB Benefit Sky Matrix that takes into account the set temperature and decides whether the energy falling on the building is taken as solar gain or as cooling energy increase.
We can choose via analysis period in which range the analysis should be calculated.
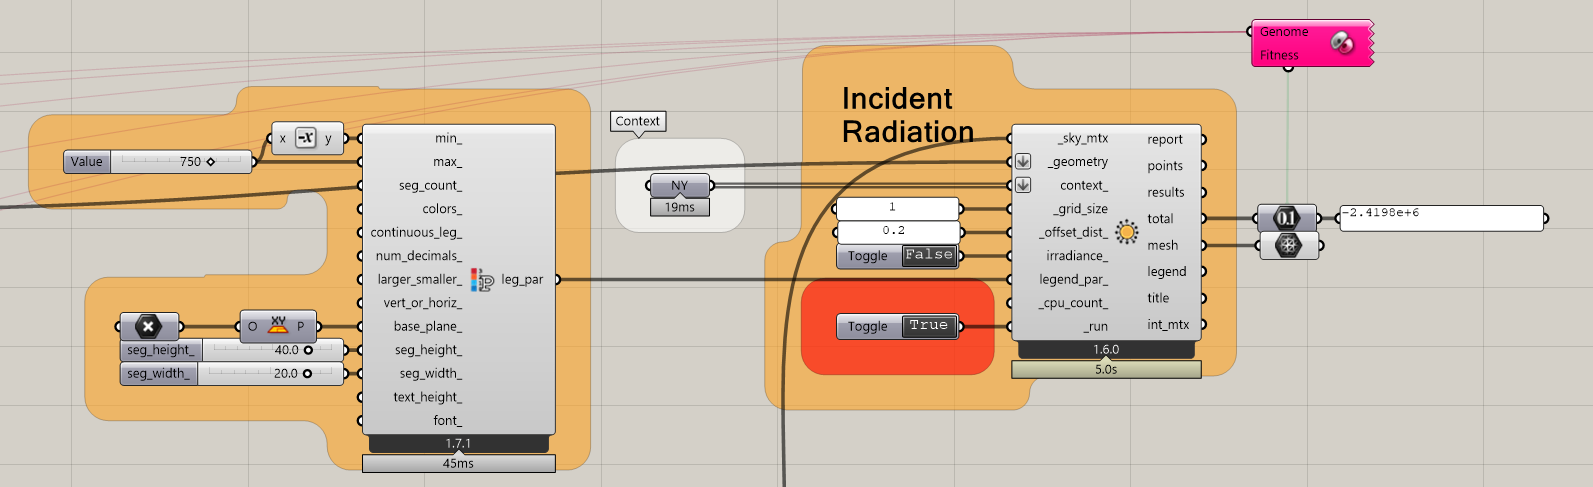
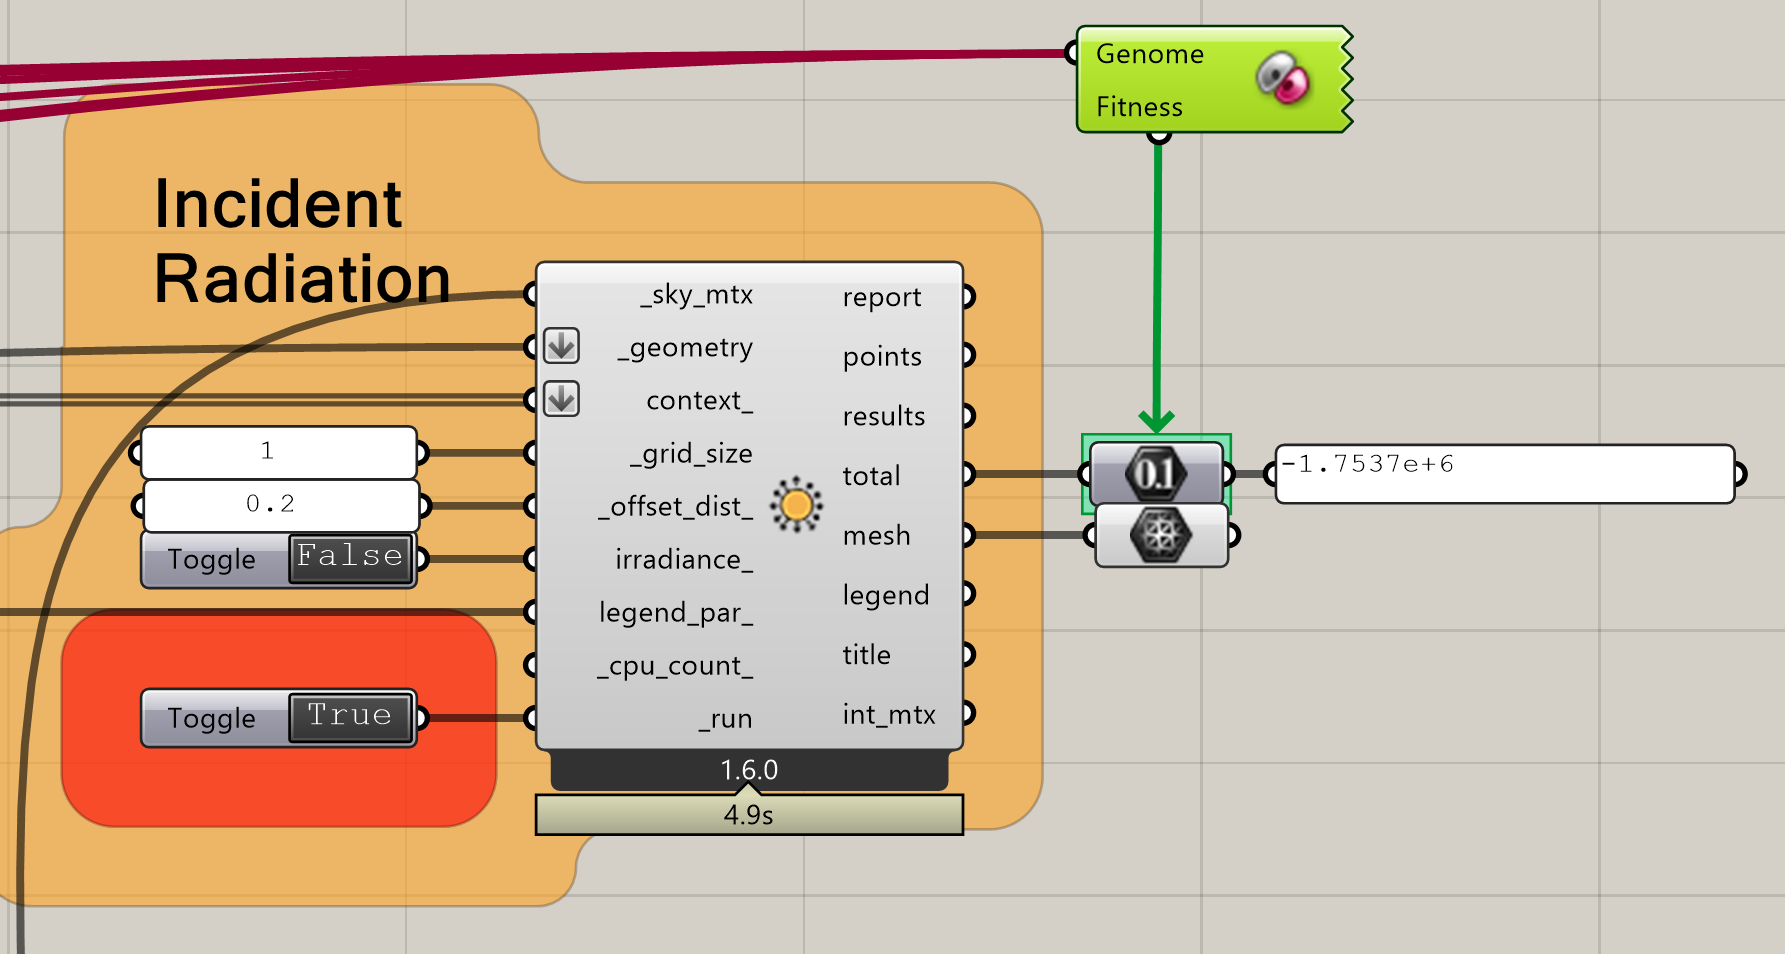
Incident radiation analysis
Incident radiation is calculated based on climate data from the sky matrix and the context that shadows the considered geometry.
Use the legend parameters to set the same legend for all three locations.
The result is the total amount of energy impacting the building in kWh.
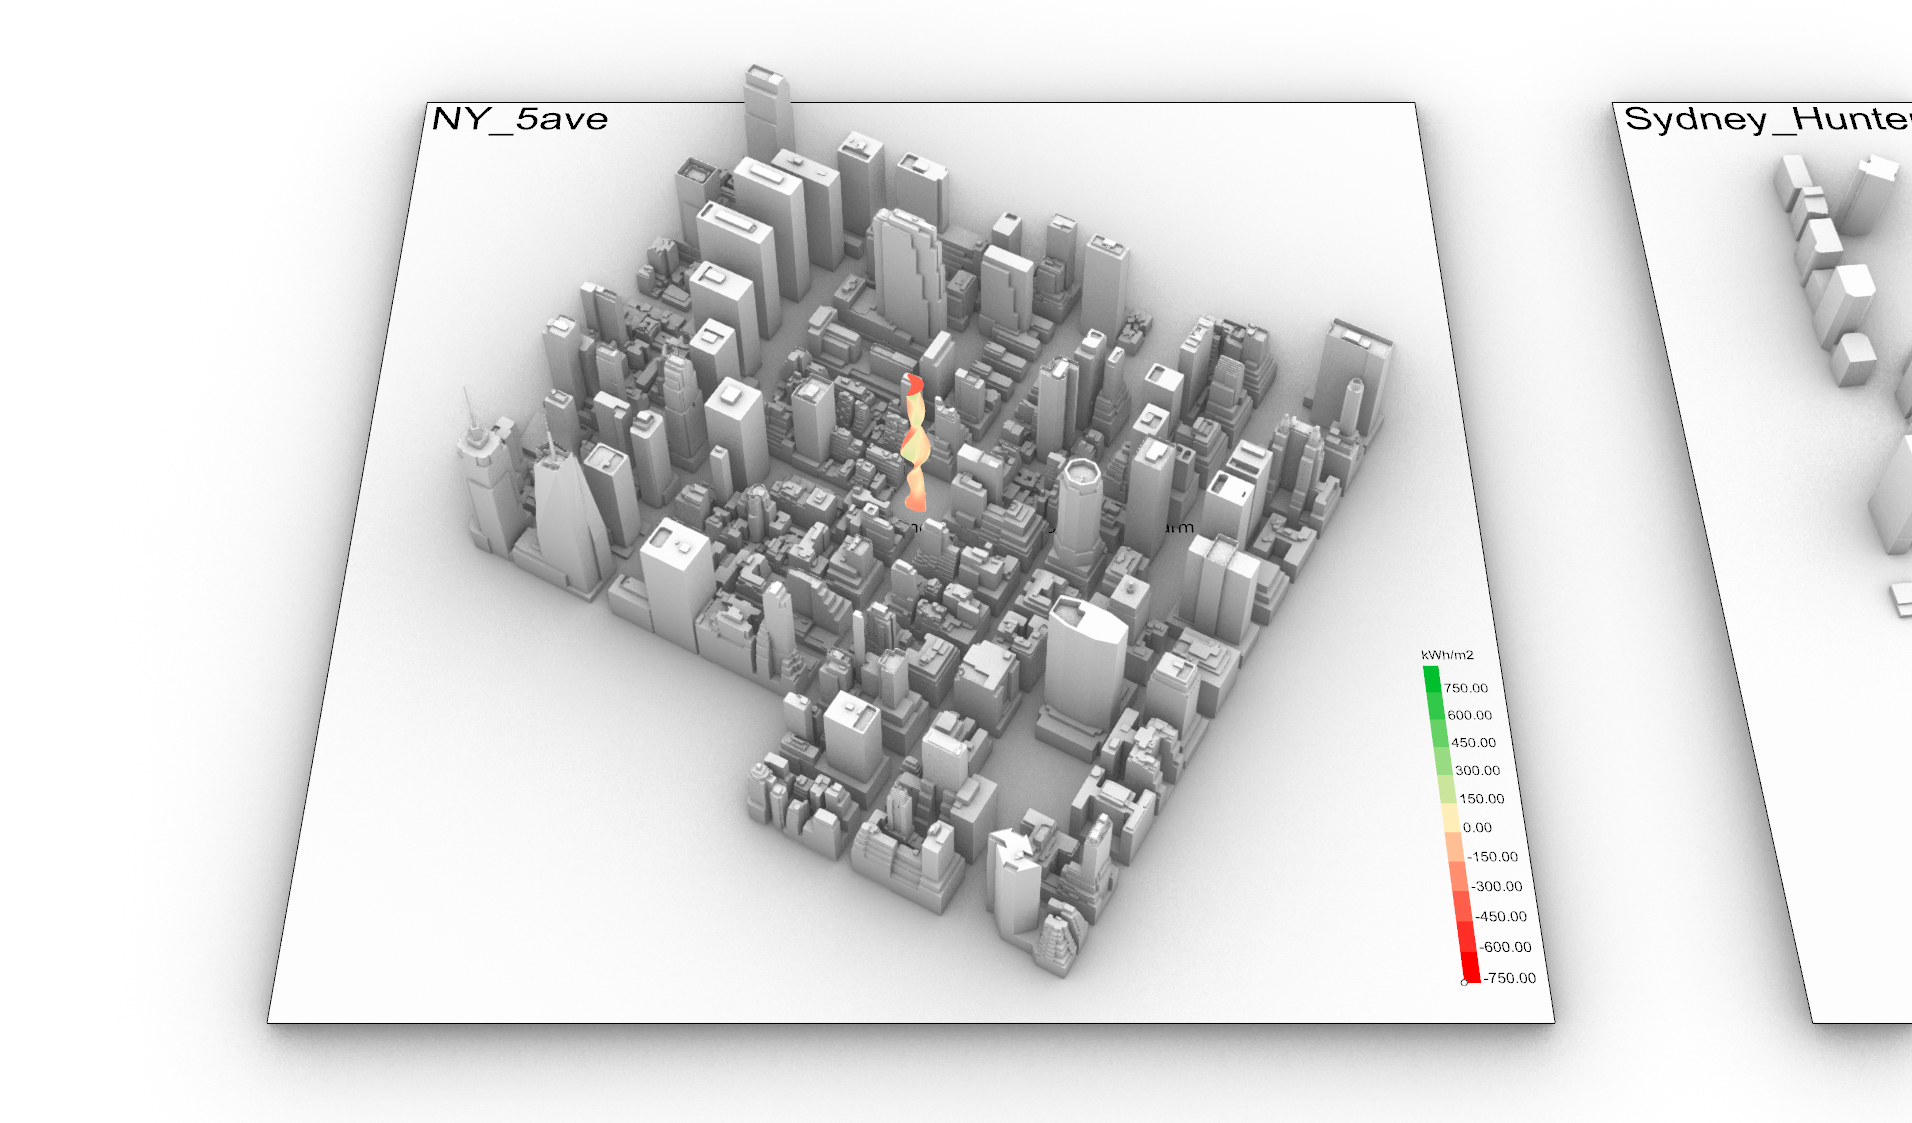
Results
As a result, we have a colored mesh. The colours correspond to the amount of energy hitting the mesh face according to the legend.
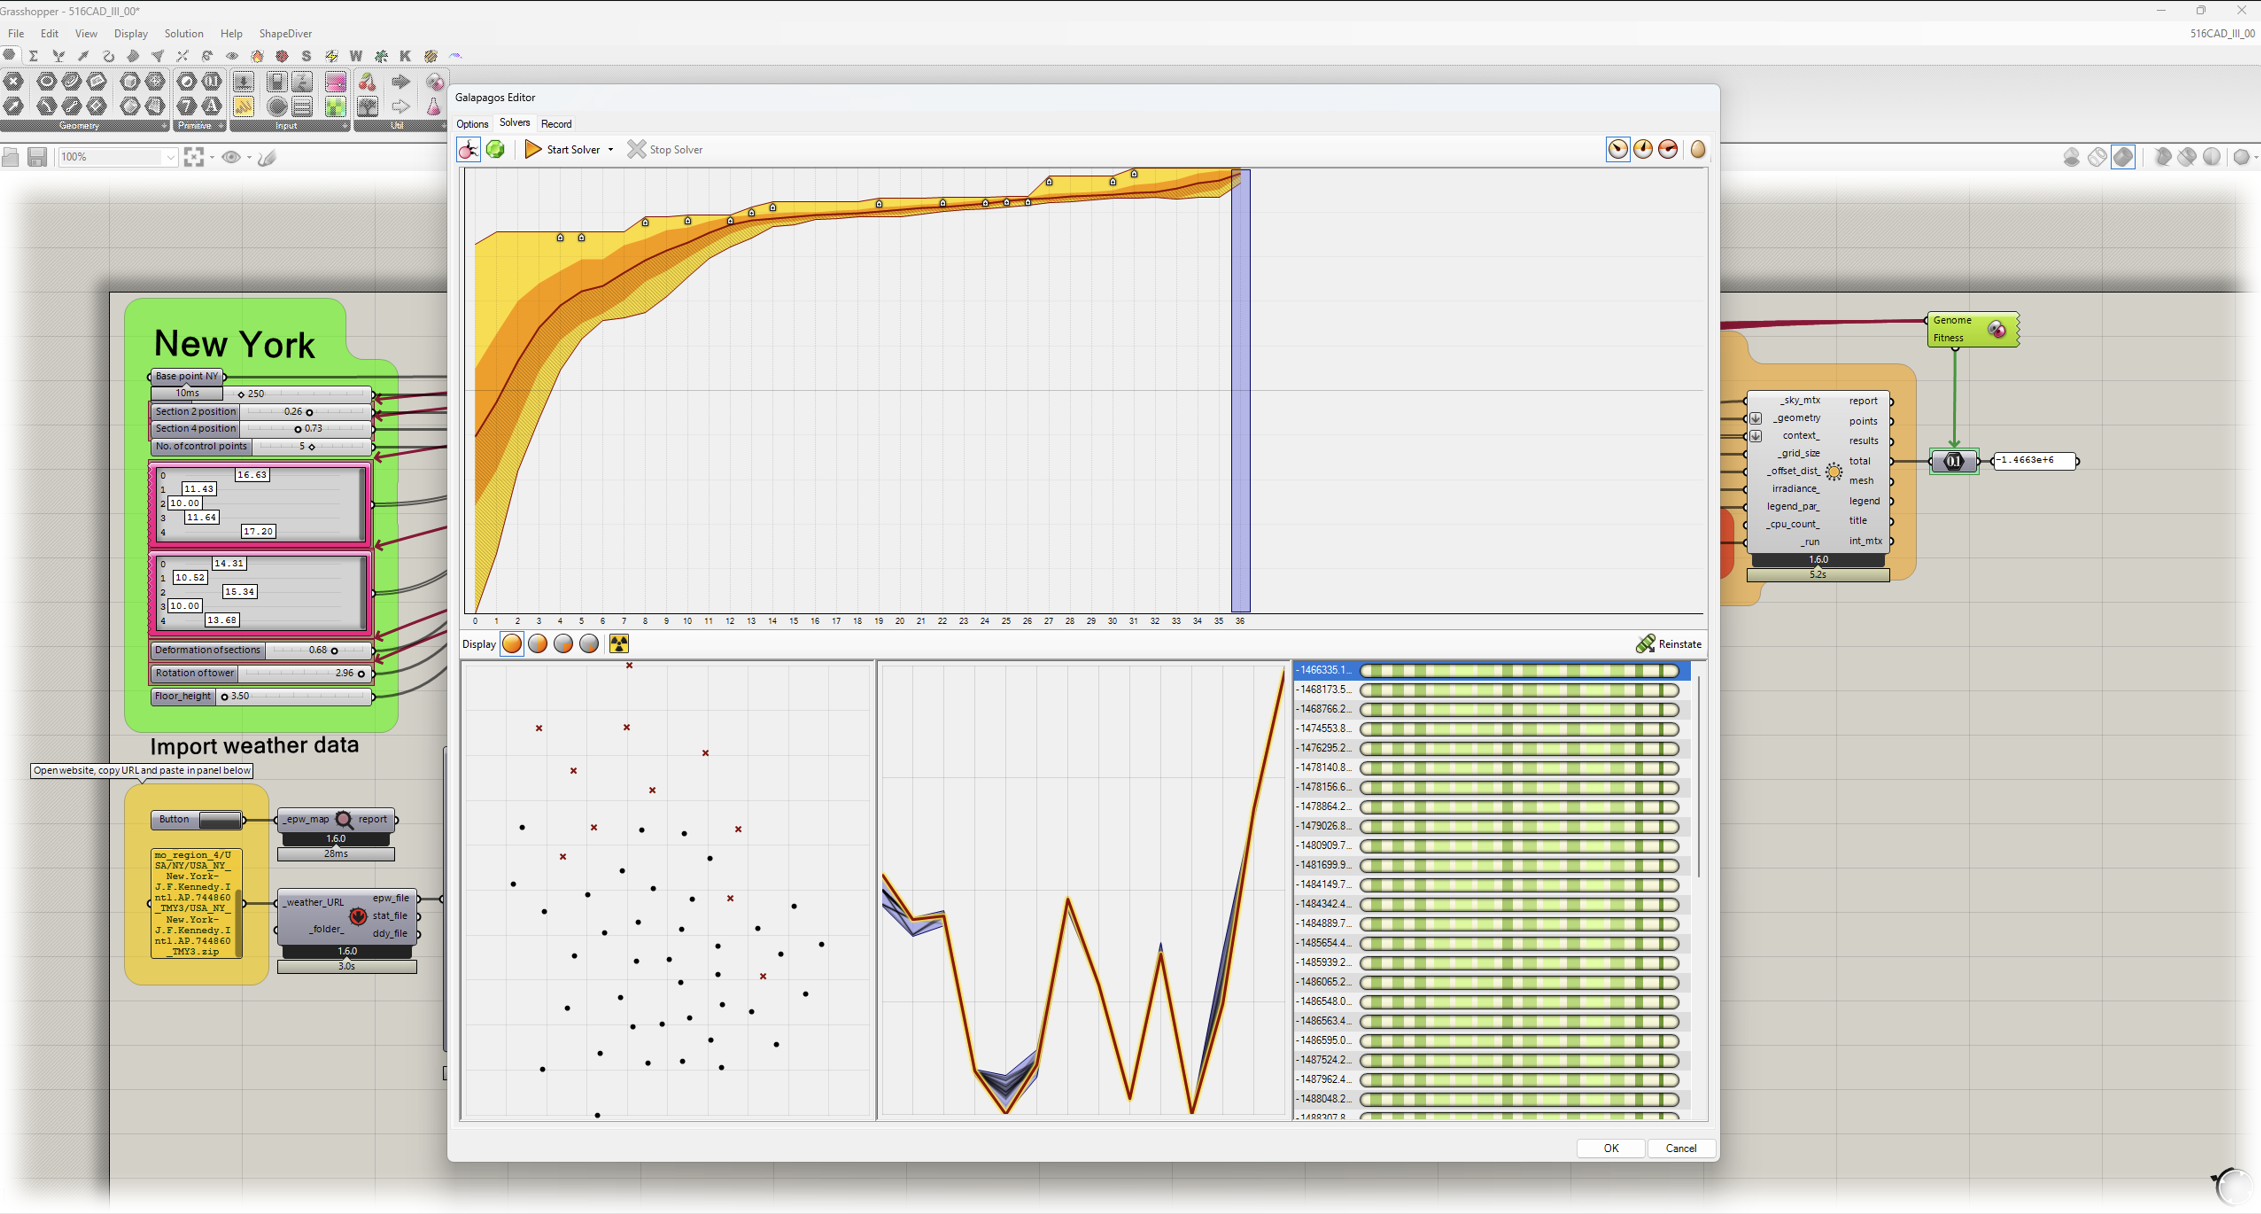
05_Galapagos
The aim was to maximise solar gains and reduce overheating of the building. Solar gains have a positive value in the analysis and overheating has a negative value, so the goal was to get as large number as possible. In galapagos we set the analysis to maximize.
Set sliders as input to galapagos. The sliders selected for analysis can be seen in the image below.
Galapagos is testing different combinations of sliders. There are 100 variations in the zero generation and 50 in each of the next generations. 5% of the best results are kept for the next generation and 75% are brand new.
06_Conslusion
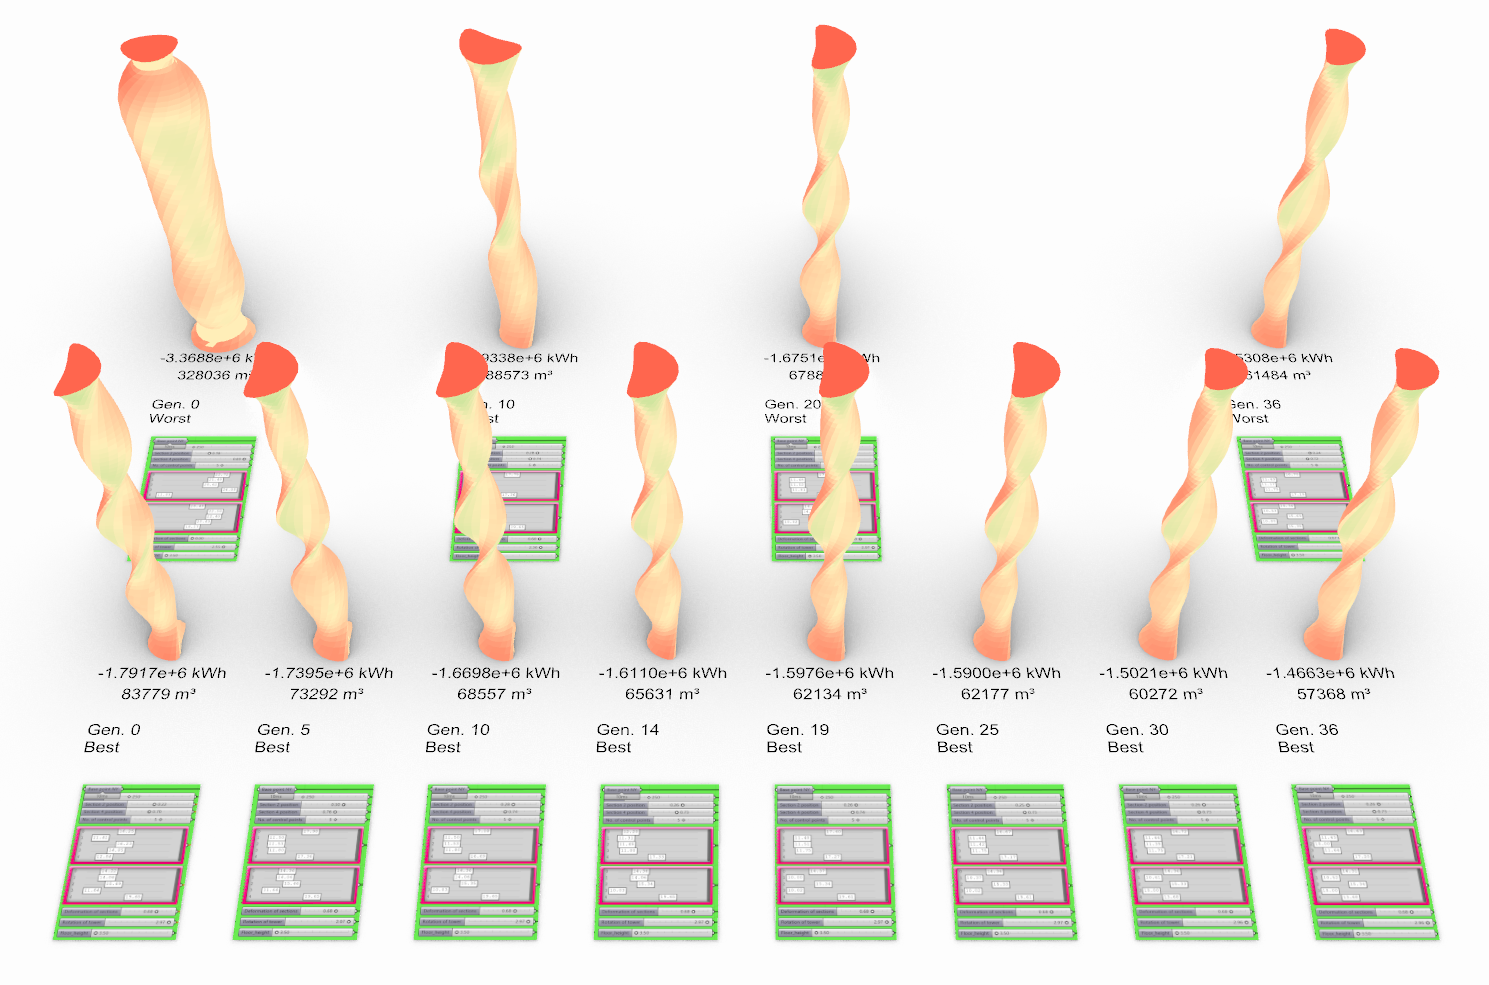
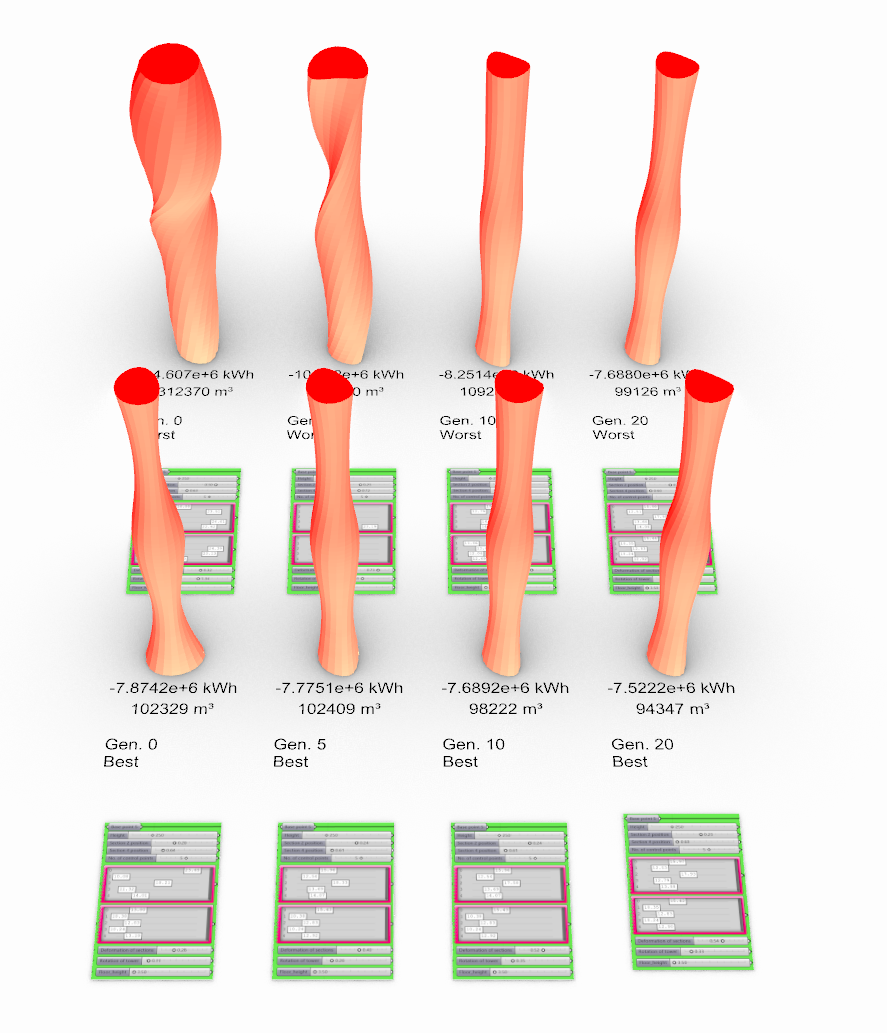
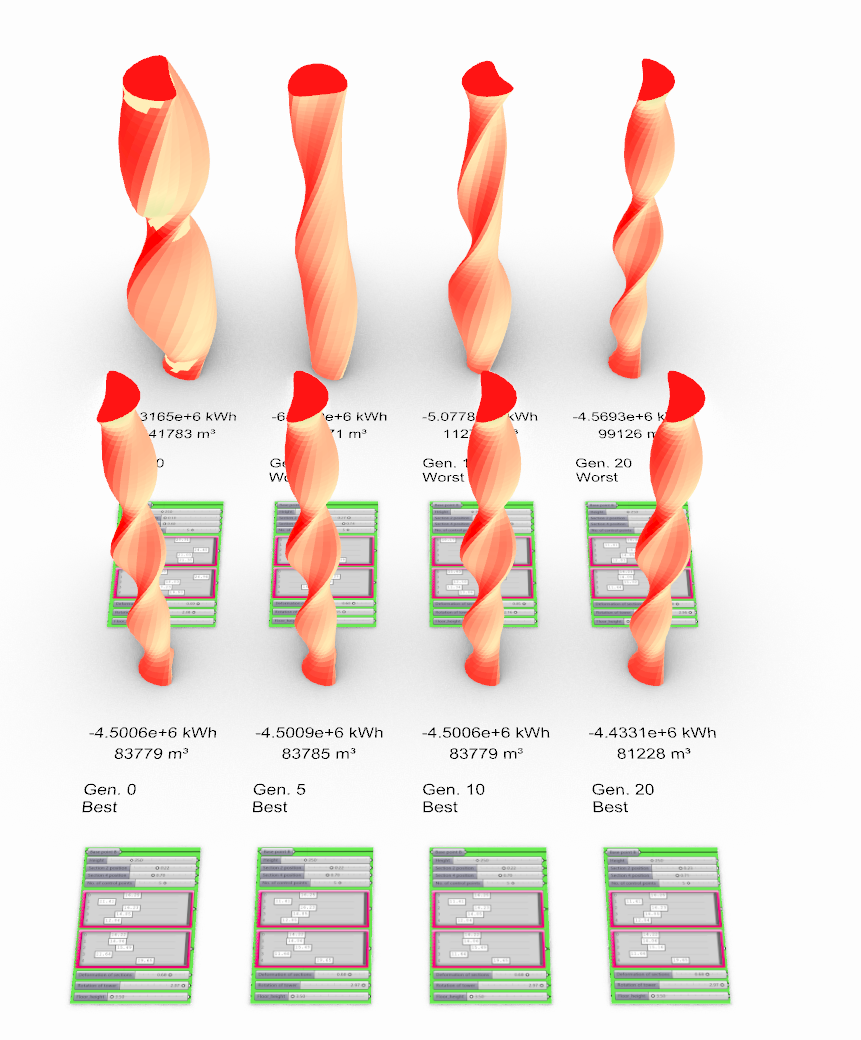
I tested 36 generations on the New York variant. 20 generations on Sydney and Barcelona. In the attached file you can compare the individual optimization results. For each mass, the generation, whether it is the best or worst option, the achieved values of incident energy on the building and the volume of the mass are given.
The results show the inappropriate creation of the skyscraper script. I consider it to be a mistake to limit the rotation to only one direction (values from 0 to 3π). It would be better to set the range from -3 to 3π. In some of the cases it might be advantageous to rotate the building in the opposite direction.
It would also be appropriate to normalise the volume of the building. In all cases it can be seen that the shape does not really change over generations, only the volume is reduced and thus better results are achieved.
Also, the range of the legend could have been chosen better. Because of the small outliers, the maximum values for Barcelona and Sydney are not well seen. Even so, the differences between the locations are clearly visible.
For such a tall building, the influence of the surroundings on its shape is also minimal.
Despite the imperfection of the building script, we can see interesting differences between the different variants and locations.
07_Acknowledgements
Thanks to Mostapha Sadeghipour Roudsari and Chris Mackey for developing the Ladybug tools.
https://www.food4rhino.com/en/app/ladybug-tools
https://www.ladybug.tools/index.html