00_INTRODUCTION
This exercise aimed to try out and prepare a script that I could possibly use in the next semester for analyzing my project, with a strong focus on public space. A script that would evaluate my design and give me analytic feedback. For this purpose, I decided to use the H.I.V.E. plugin, which provides a way to analyze public space through agent-based simulations.
01_TESTING THE AGENT’S BEHAVIOUR
Before analyzing the large square area, I first conducted several small experiments to observe how the agents behave. These tests were designed to examine their movement patterns and reactions, for example, how they respond to an obstacle or how they navigate through open space. Doing these simple tests gave me a better understanding of the simulation before applying it to the full public space.

02_OLOMOUC SQUARE

- PROGRAMME CONSTRUCTION – In Rhino, I prepared the surface area of the square, added entry points on the edges as gates and targets (so agents can enter and leave the public space through these points), and I defined public water fountains as attractors. I also drew two closed curves for the market zones A and B.

2. AGENT CONSTRUCTION – For this specific simulation, I used a total of 180 agents. I did not differentiate them by age. Instead, kept one broad general group ranging from 9 to 90 years old.

3. ENVIRONMENT CONSTRUCTION – In my case, I set the Grid Size to 2m, the number of iterations to 2200, and the number of agents to 180. These three values are the key parameters that influence the overall result of the simulation. All this allowed me to initiate the simulation.

4. MARKET AREA EVALUATION – Additionally, I marked 2 specific areas on the square that I wanted to compare and evaluate in terms of the number of passing agents. This result can be used, for example, when deciding the placement of markets, info points, kiosks, or greenery. For each area, I used a script that processed the results of the simulation. Each agent had its own path through the square, and I examined how many of those paths crossed the selected areas. The outcome was a value representing the number of unique agents passing through each zone, which then allowed me to compare the two locations.

03_PLUGIN LIMITATIONS
Originally, I wanted to use the plugin to simulate movement on an unbuilt square designed by Studio Hnilička, but here exactly the problems I described above appeared – such as the inability to move in narrow street spaces or the tendency to head straight from gate to target without considering obstacles. That is why I later chose the square in Olomouc, which by its open character is more suitable for this plugin.
In this initial experiment, I aimed for greater detail, defining Targets and Gates much more precisely, for example, by marking all entrances and exits of public buildings and residential houses. I also designated the market area on the square and identified all public greenery from the design as attractors. The main issue arose from the road running through the center. I marked it as inaccessible for agents and did not allow them to cross it except where traffic-calmed. This created an unrealistic concentration of interactions in places where, in reality, people would simply walk around. As a result, interactions did not occur in front of entrances, exits, or greenery, but in places caused by the plugin’s limitations.

04_AGENT MOVEMENT PRINCIPLE
The movement of agents in the plugin is based on the principle of cellular automata. The space is divided into a grid of cells, and agents move step by step according to given rules. From these local rules, overall movement patterns in the space emerge. Precisely because of this principle, the plugin is not able to make agents avoid obstacles or perceive the space as a whole, since their movement follows strict rules at the “local” level.
YT video explaining the principle
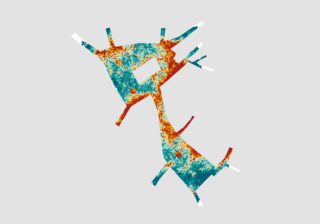
05_3D DATA VISUALISATION
The output of the simulation is normally represented only with a flat color scale in 2D space. I wanted to extend this and be able to visualize the data also in 3D.

I only applied the script to a small area, since it is computationally demanding and my CPU cannot handle it on the whole square.
- From the data about agent movement and socialization, I identified the places where interactions occurred.

2. I overlaid the space with a grid and counted how many interactions were near each grid point. Then mapped these counts into height values and moved the grid upward along the Z-axis.

3. Last, I created a surface from the points in 3D space, which is represented by contour lines.

06_EVALUATION
My evaluation has two levels. In the first, I wanted to test and prepare a script that analyzes public spaces, which I could later use in my studio work next semester. This also included testing the behavior of agents. I consider this first part quite positive, because it met my expectations and the script I was working with can be reused in my future projects.
The second part concerns working with the data produced by the simulation. Here, I see the biggest problem in the behavior of the agents. Their inability to navigate around obstacles is a weak point of the whole plugin. Because of this, it cannot be reliably applied to more complex environments such as urban street networks. This also limits the ways the data can be further used.

The bottom script (not connected) is for spatial visualisation.
07_ACKNOWLEDGEMENTS
Thanks to Puja Bhagat and Jonathan Wong for developing the H.I.V.E. plugin.
https://jrwong158.wixsite.com/hivepedestriansim
08_FILES