
Cardboard pavilion design comparison using LCA + Radiation analysis data
// This tutorial uses and pursues the work done in this tutorial //
After having enabled the creation of a curved wall made out of cardboard cylinders (slighty offset to ensure a continuity of the inuslation thickness), in this tutorial we’ll now proceed to the completion of this wall design to a pavilion-like building, allowing the live-time calculation of the Life Carbon Assessment and a sunlight analysis of the pavilion. The final aim of this project is to gather all this data workflow (quantity, prices, embodied carbon, sun hours, incident radiation…) in a single Excel spreadsheet in order to facilitate the result visualization, and thus leading to a better decision making regarding the shape and orientation of the pavilion.
For that, 3 cases will be designed, analyzed and compared in this tutorial.
1/ Design of the cardboard pavilion-like structure
From the cardboard wall designed and obtained using this tutorial, few addings were made in order to have a pavilion-like building [with the parameters the user can tune/adjust] :
- openings are created, evenly place along the curved wall [number of openings and their width]
- a slab and ceiling – acting like a shading item [thickness and offset length from the initial curve]
- columns [structural grid divisions U/V]
- glass curtain wall, as the partition of this pavilion, on the outline of the columns grid [thickness of the glass]
3 cases designed
All that is needed to obtain the whole pavilion is a single input : a closed curve. Here are the 3 cases designed from 3 differents closed curve, having roughly the same surface, around 150m2 [with the same number and dimensions of openings that is to say 7 openings, each 1.8m wide].
2/Life Cycle Assessment (using Cardinal LCA)
In this part we’ll have a look at the embodied carbon impact of the pavilion, using Cardinal LCA, a grasshopper plug-in allowing the calculation of the total amount of kgCO2eq emitted during one specific stage of the life cycle of the building. Indeed this tool mainly focuses on the first three stages of LCA highlighted below, so it is important to bear in mind that the values obtained in this tutorial are only part of a bigger carbon impact.
Source : https://browningday.com/news/lca-stages-matter-when-tracking-embodied-carbon/
The way this plug-in works is pretty simple as it only needs Brep and MaterialInfo of the corresponding volume. Once this data has been filled in, it is then merged and processed. Beyond its easy handling, this plug-in also has an in-built graph display (bar chart type), allowing to have a quick overview of the distribution of the carbon impact per layer or per material used.
The following materials were used for each layer mentionned below (in the yellow text panels) :
- SLAB : Concrete RC25/30 (CEM I)
- CEILING : Concrete GEN1 (CEM I)
- COLUMNS : Steel UO Pipe
- PARTITION : Single glass panel
- CARDBOARD : Cardboard (custom material, using INES database)
- INSULATION : Insu. (custom material, using INES database)
Overview of the Cardinal LCA components, used for the calculation of the embodied carbon impact of the geometry designed
Given that the geometry of the Cardboard wall and its inner Insulation is relatively complex, an equivalent volume (Box of 1m high, varying length and width) is created and listed in the Brep GeometryInfo of the Cardinal LCA component, having the exact same volume as the Cardboard and Insulation (calculated from the perimeter of each geometry).
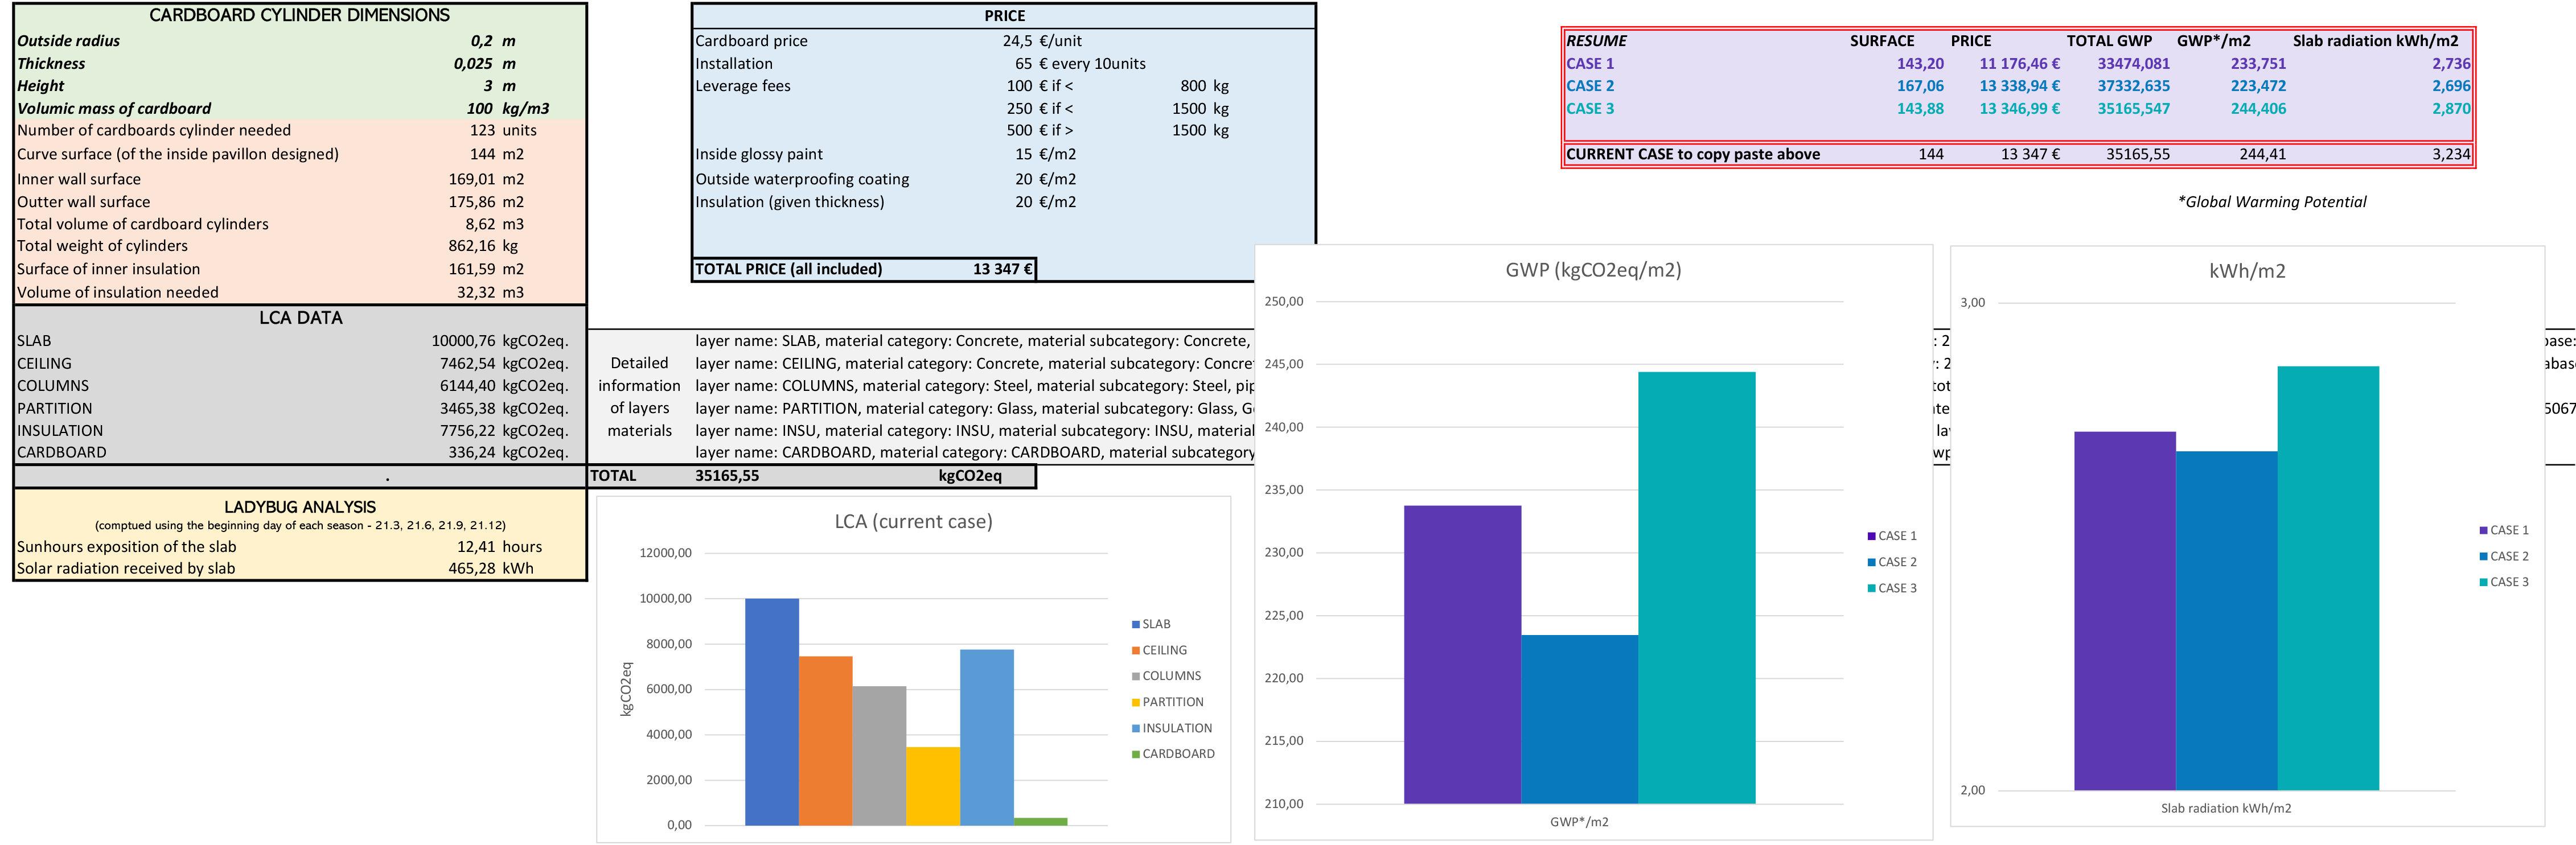
Once updated in real time on the Excel sheet (thanks to the TT Toolbox option “Write To Excel”), this is what is displayed regarding the last and current case designed :
Embodied carbon impact per layer (stages A1-A3)
3/ Solar radiation analysis (using Ladybug-Honeybee)
A conventional solar analysis is executed in this part, using Ladybug plug-in (more precisely Honeybee tools) and a epw. file gathering all the weather data of Prague. The pavilion is thus located in Prague, and oriented such as the y-axis is pointing toward the north (and x-axis towards the east). In order to speed up the analysis without reducing too much the overall results, these analysis were done for the 4 following days (beginning of each season) : 21/03, 21/06, 21/09 and 21/12 (using a time step of 2h).
Incident solar radiation (received by the slab) with two different opening sizes, during 4 days (start days of each season)
Outcomes of this analysis are sent to the Excel sheet for a live visualization , two values are obtained :
- Total sunhours exposition of the slab (in hours)
- Average value of the solar incident radiation of the slab (in kWh/m2)
4/ Comparative overview of the 3 cases
Final comparison with key data
Finally, the two graphs shown above highlight the main results obtained after the different steps presented.
For these examples, it is hard to bring a case out of the three designs, as the one with the least embodied carbon impact is also the one that receives the least amount of incident radiation. However, the 3rd case, thanks to its orientation mainly towards the south-north (it has 3 to 4 openings facing south) gets more solar rays on its slab, eventhough its shape (with a lower compactness) recquieres more material, having an higher carbon footprint. In order to arbitrate between these different shapes we’d need an order of priority between carbon emissions and solar gains, it obviously depends on the context, use of the building and many others parameters.
Here the aim of this project isn’t to make a “winner” emerge among these cases, but rather to provide informations for the designer of these pavilions in order to facilitate the decision-making.
Overview of the Excel sheet (with data from the previous tutorial) with live synchronization with the current Rhino model
Required files for this tutorial :
// Grasshopper script – with following color scheme for groups of components : WHITE for the previous tutorial, PURPLE for geometry related components, RED for LCA related components, GREEN for Sun analysis components.
// Excel file (the file path has to be filled in the text panel next to the TT Toolbox components)
Required plugins for this tutorial :
// TT Toolbox
// Anemone
// Cardinal LCA