Concept
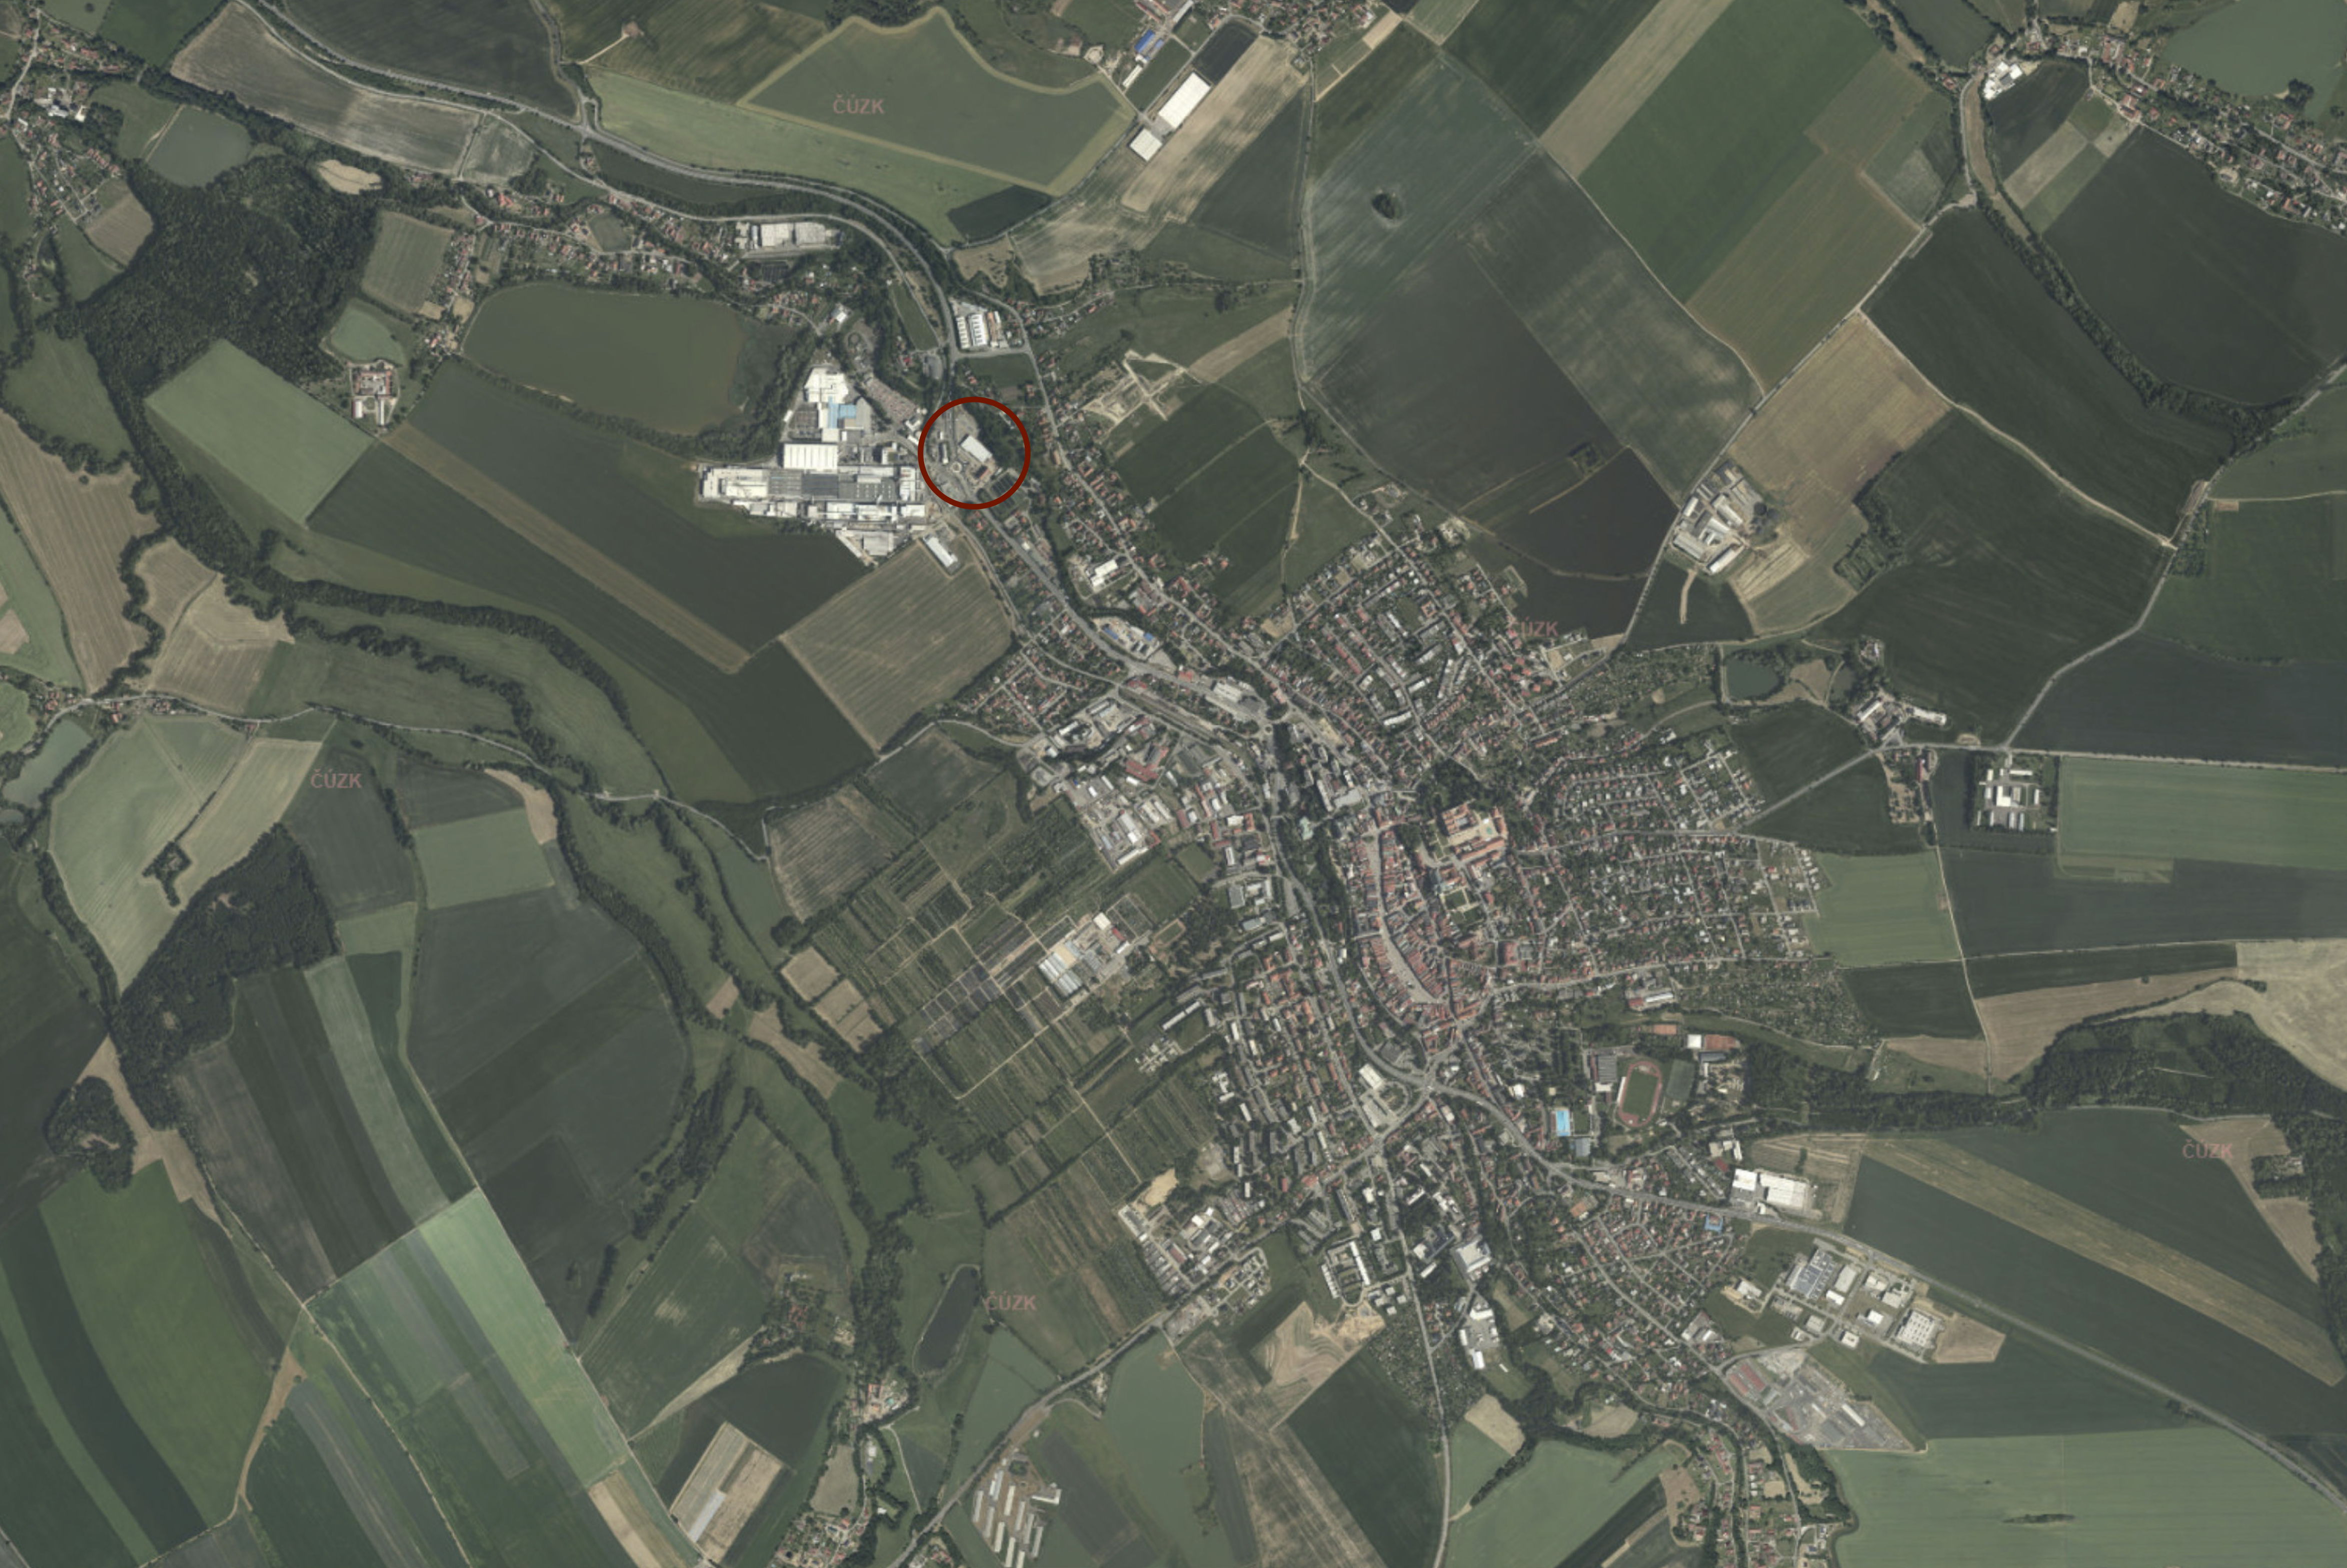
My seminar work aimed to perform a space syntax analysis in Litomyšl, a city in the Pardubice region, which I will use for the needs of my diploma project.
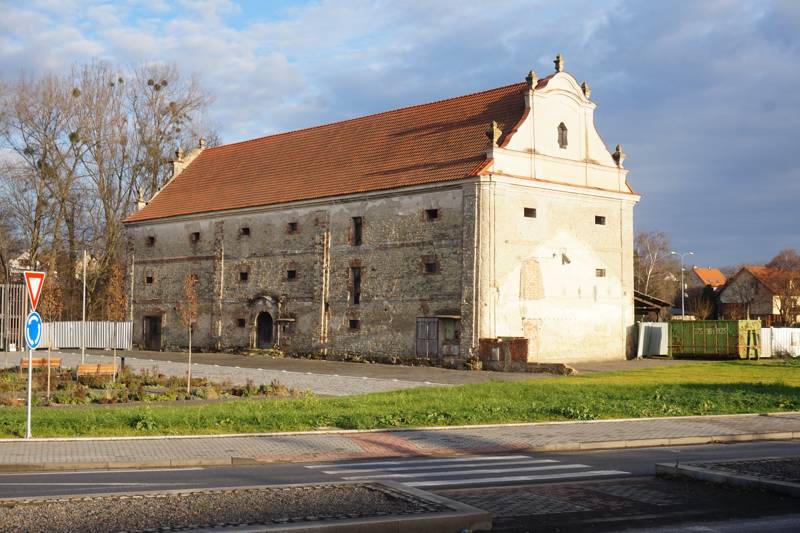
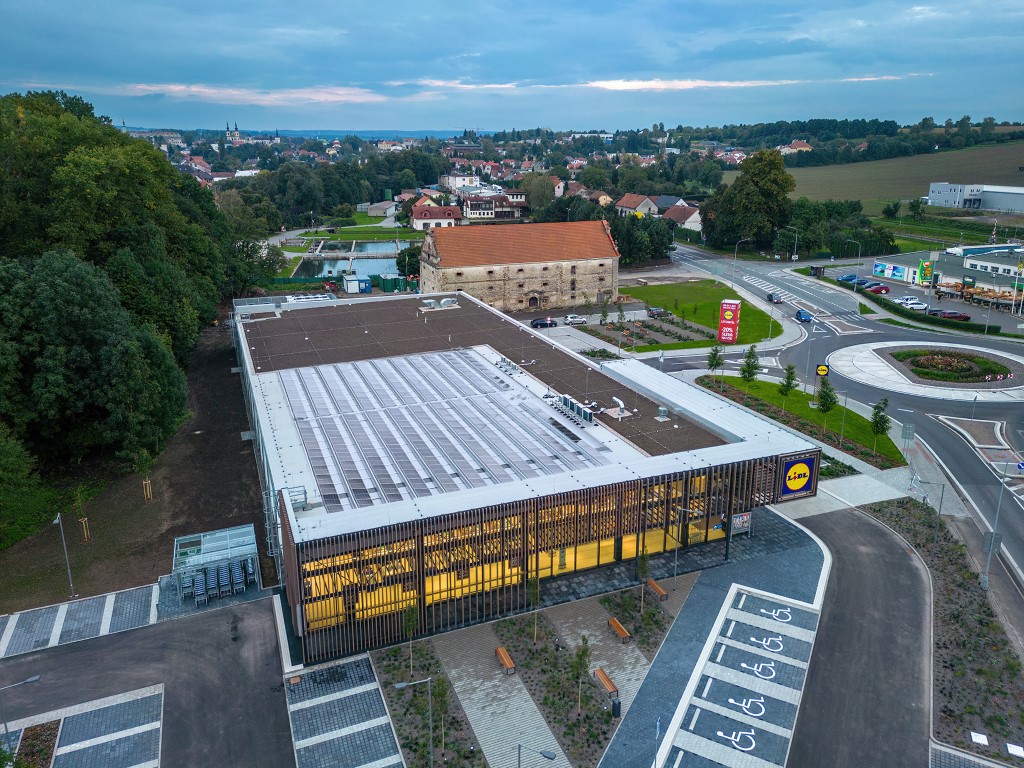
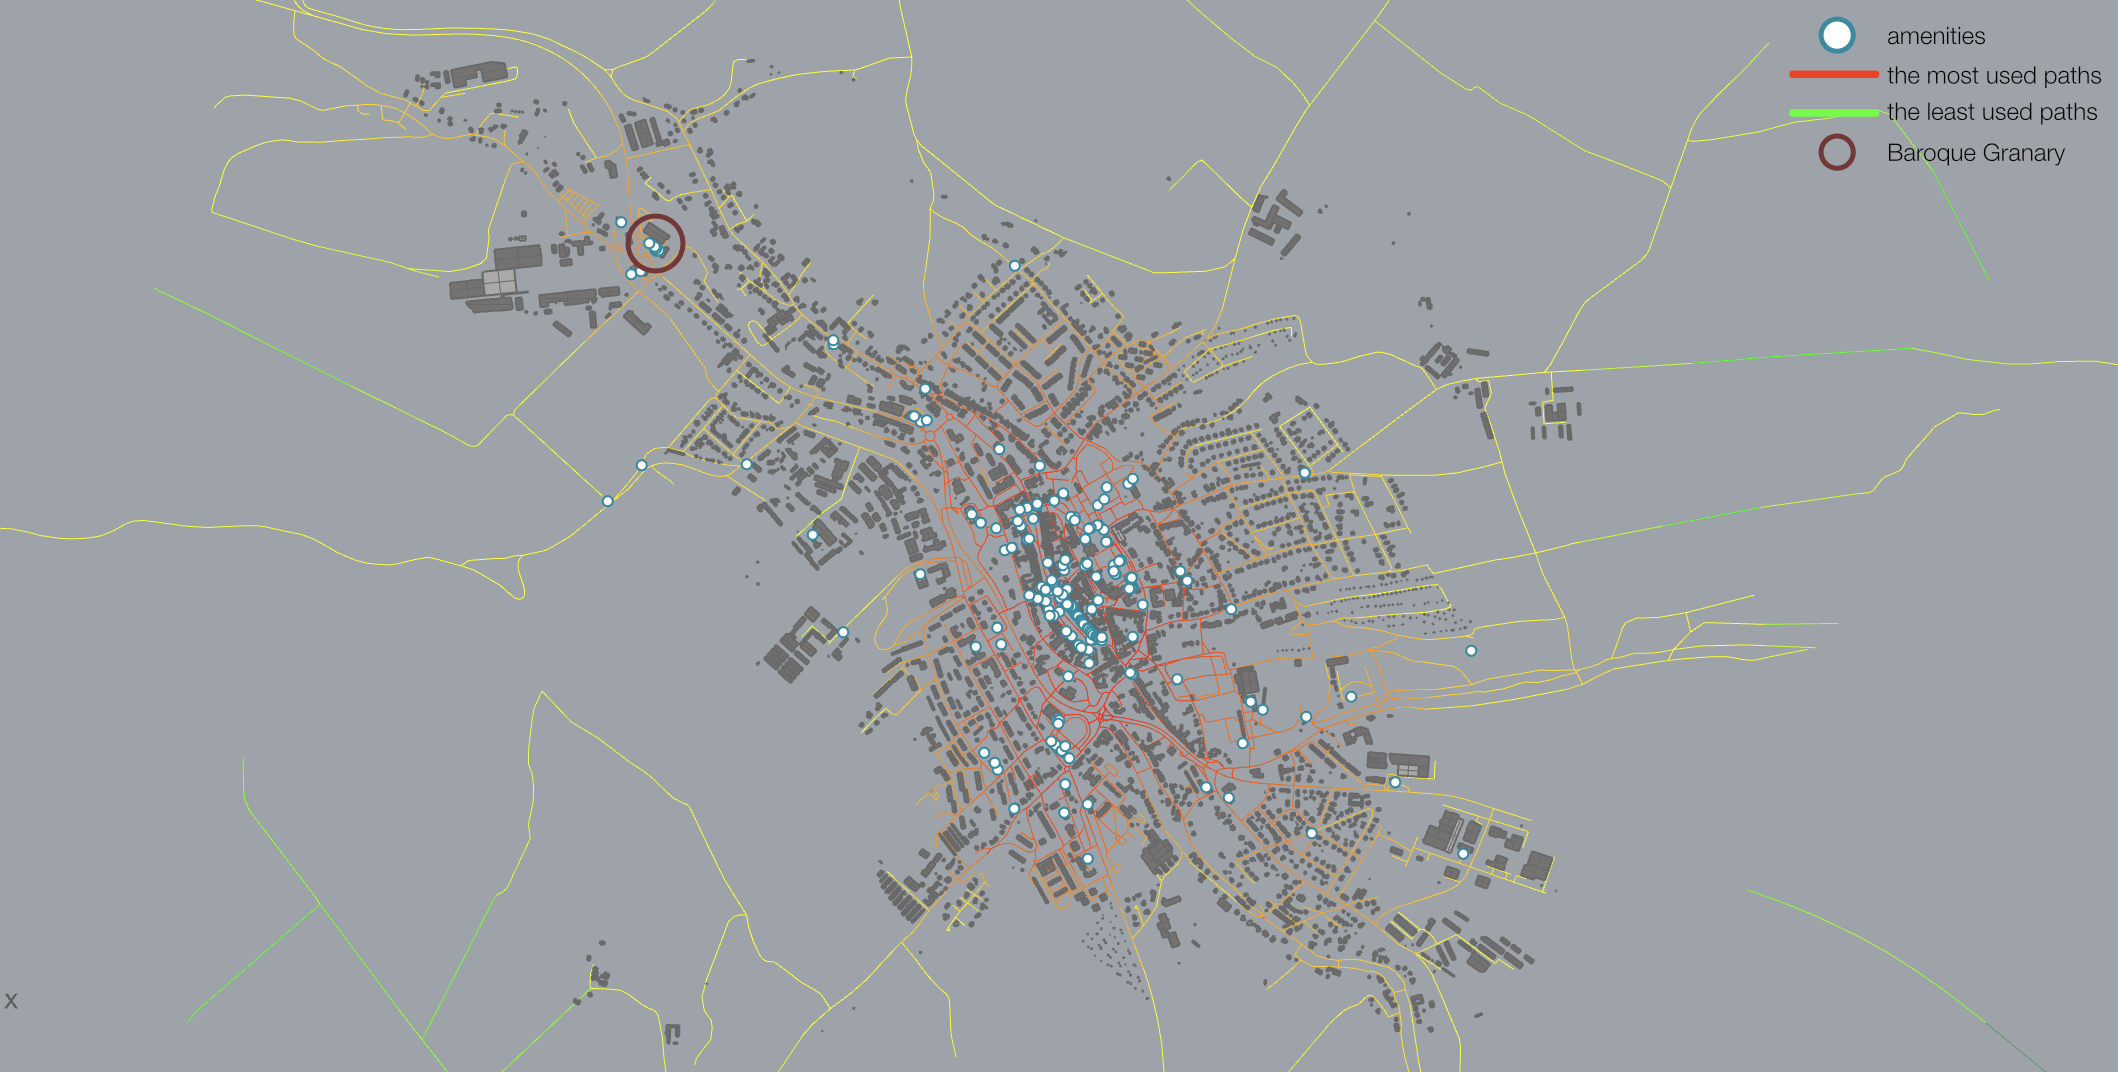
The analysis focuses on the walkability of the Baroque Granary.
For the analysis, I used a freely available path network in shapefile format, which I modified in QGIS.
https://pamatkovykatalog.cz/zemedelsky-dvur-perstynsky-13974376
https://www.stavbaroku.cz/printDetail.do?Dispatch=ShowDetail&siid=2466
Plug-ins
For the analysis I used 2 plug-ins: Urbano (by Timur) and DeCodingSpaces Toolbox.
I used Urbano to upload the shapefile to Grasshopper and load the street grid. I then used DeCodingSpaces Toolbox for the main analysis.
DeCodingSpaces Toolbox is a plug-in that has multiple functions:
Generative components:
– Street network generation
– Plot generation
– Building generation
Analytical components:
– Street network analysis
– Visibility analysis
– Data analysis
– Hydrology analysis
– Utilities
Street network analysis
There are 2 types of street network analysis.
1. Betweenness centrality:
– detecting the amount of influence a node has over the flow of information in a graph
– the algorithm calculates shortest paths between all pairs of nodes in a graph
2. Closeness centrality:
– measure of the average shortest distance from each vertex to each other vertex.
Preparing street network
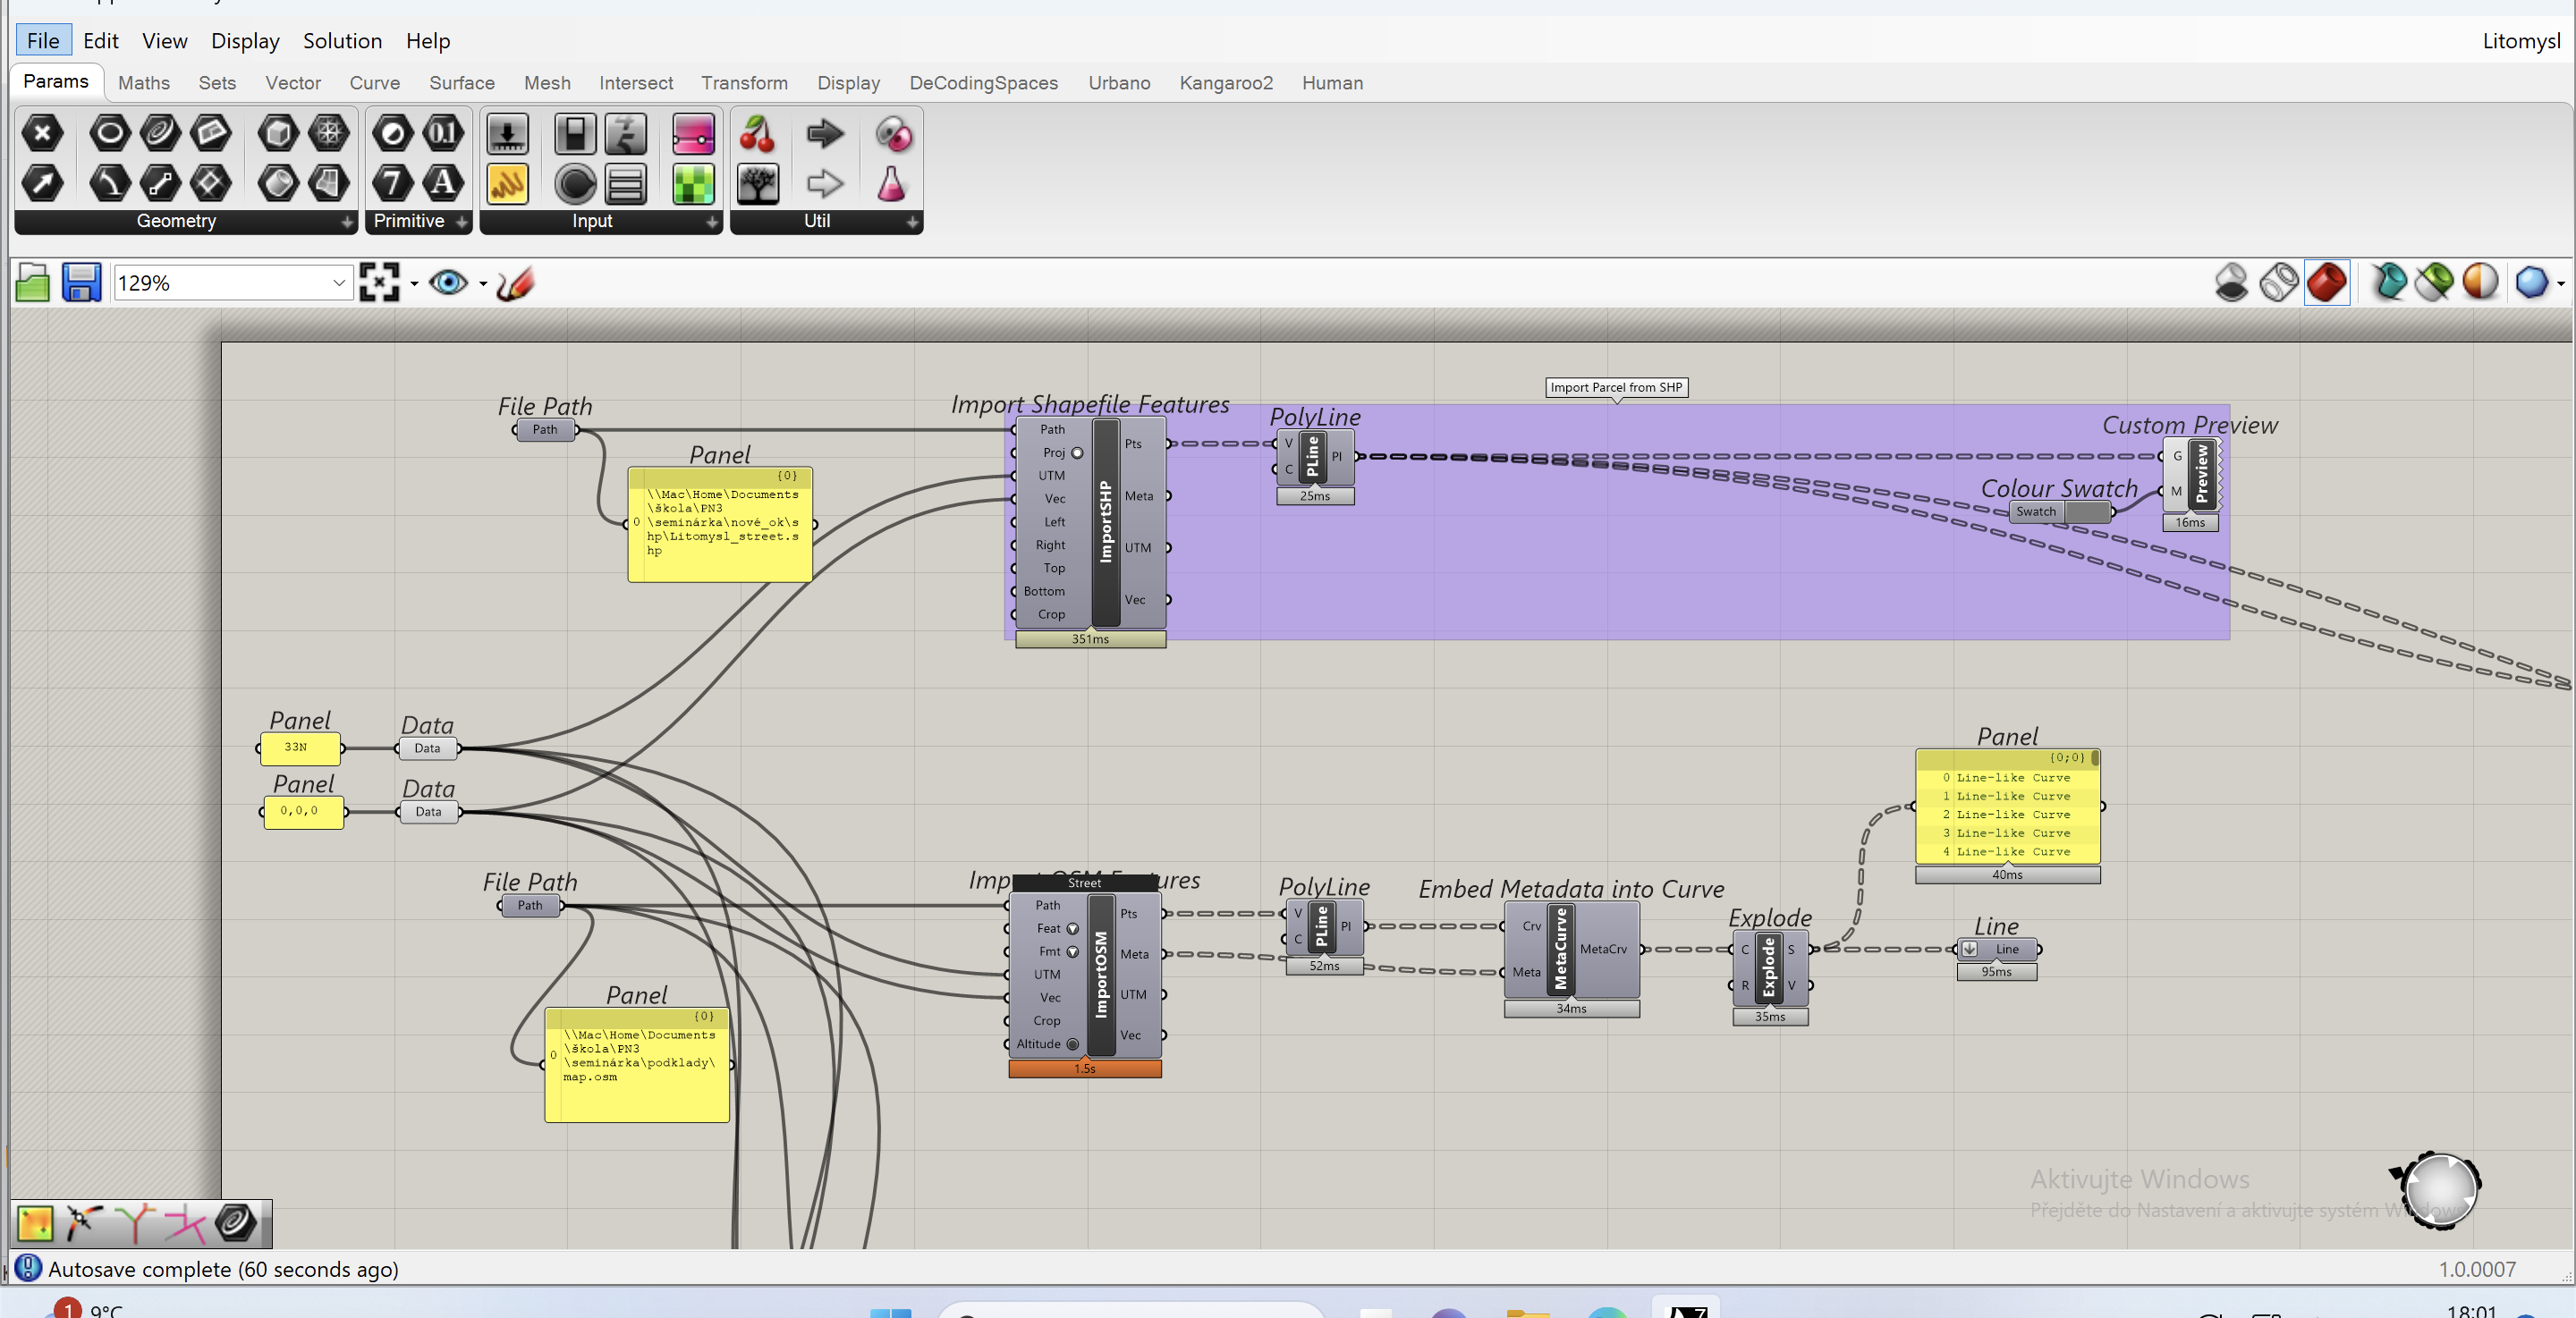
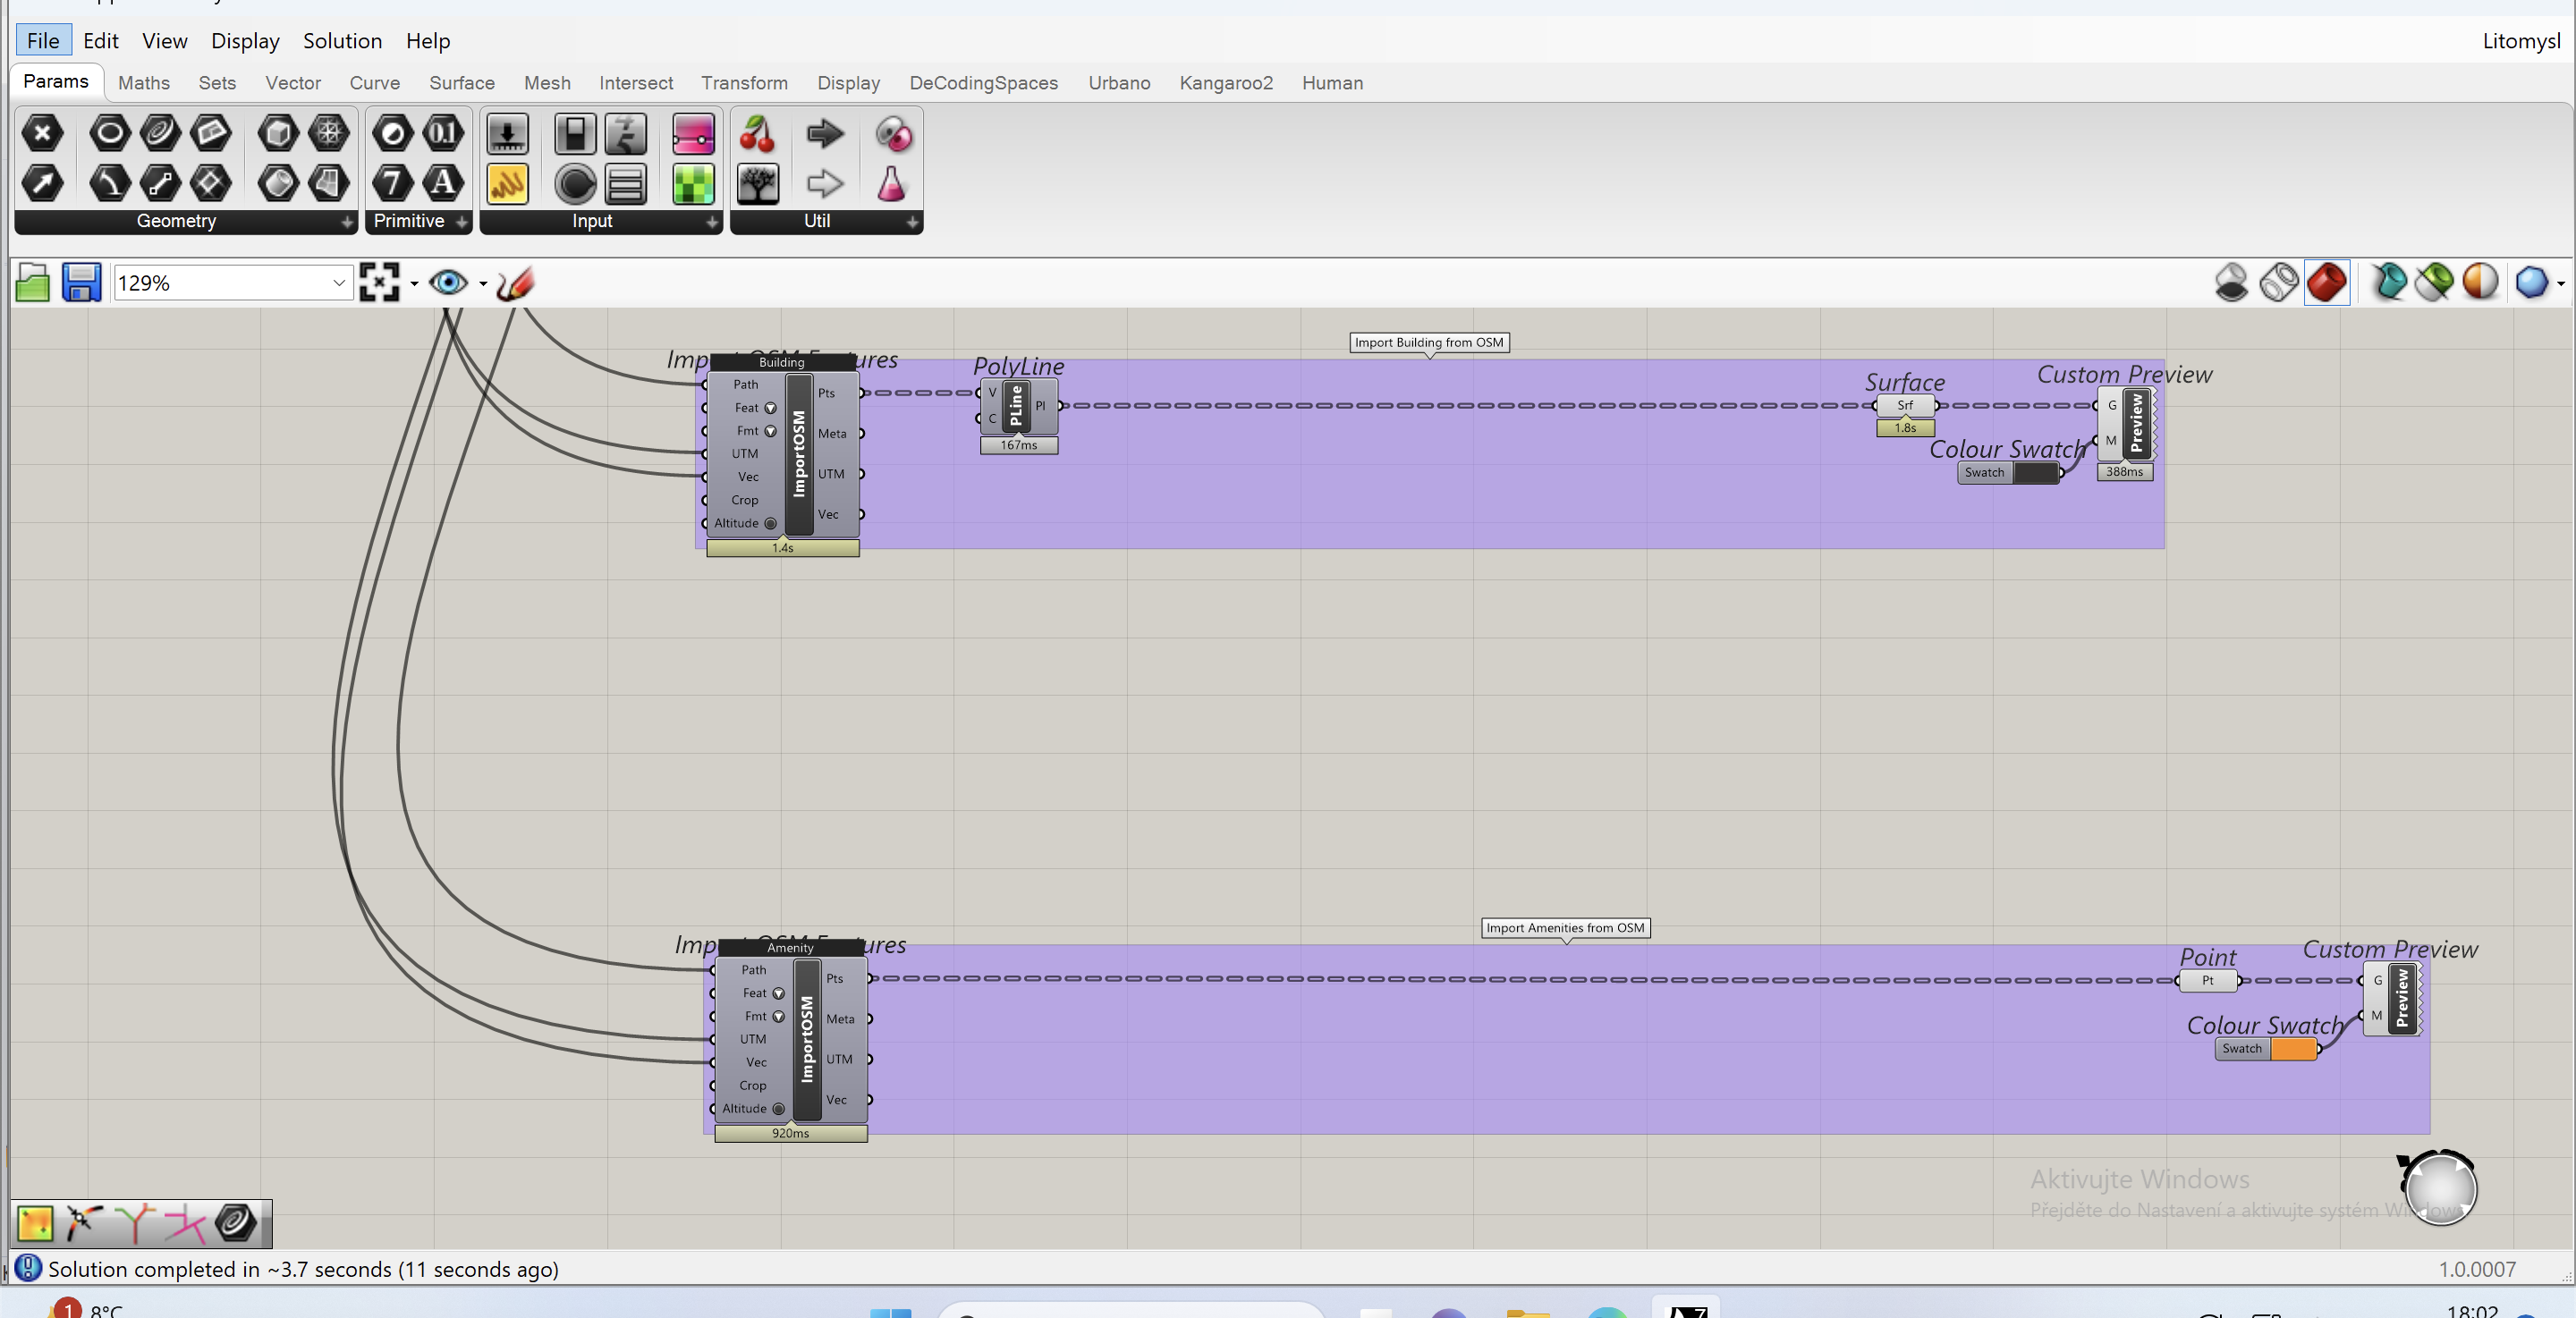
First I imported the modified shapefile data from QGIS using the Urbano plug-in. Urbano can also upload data in OSM file, which I used to display buildings and equipment.
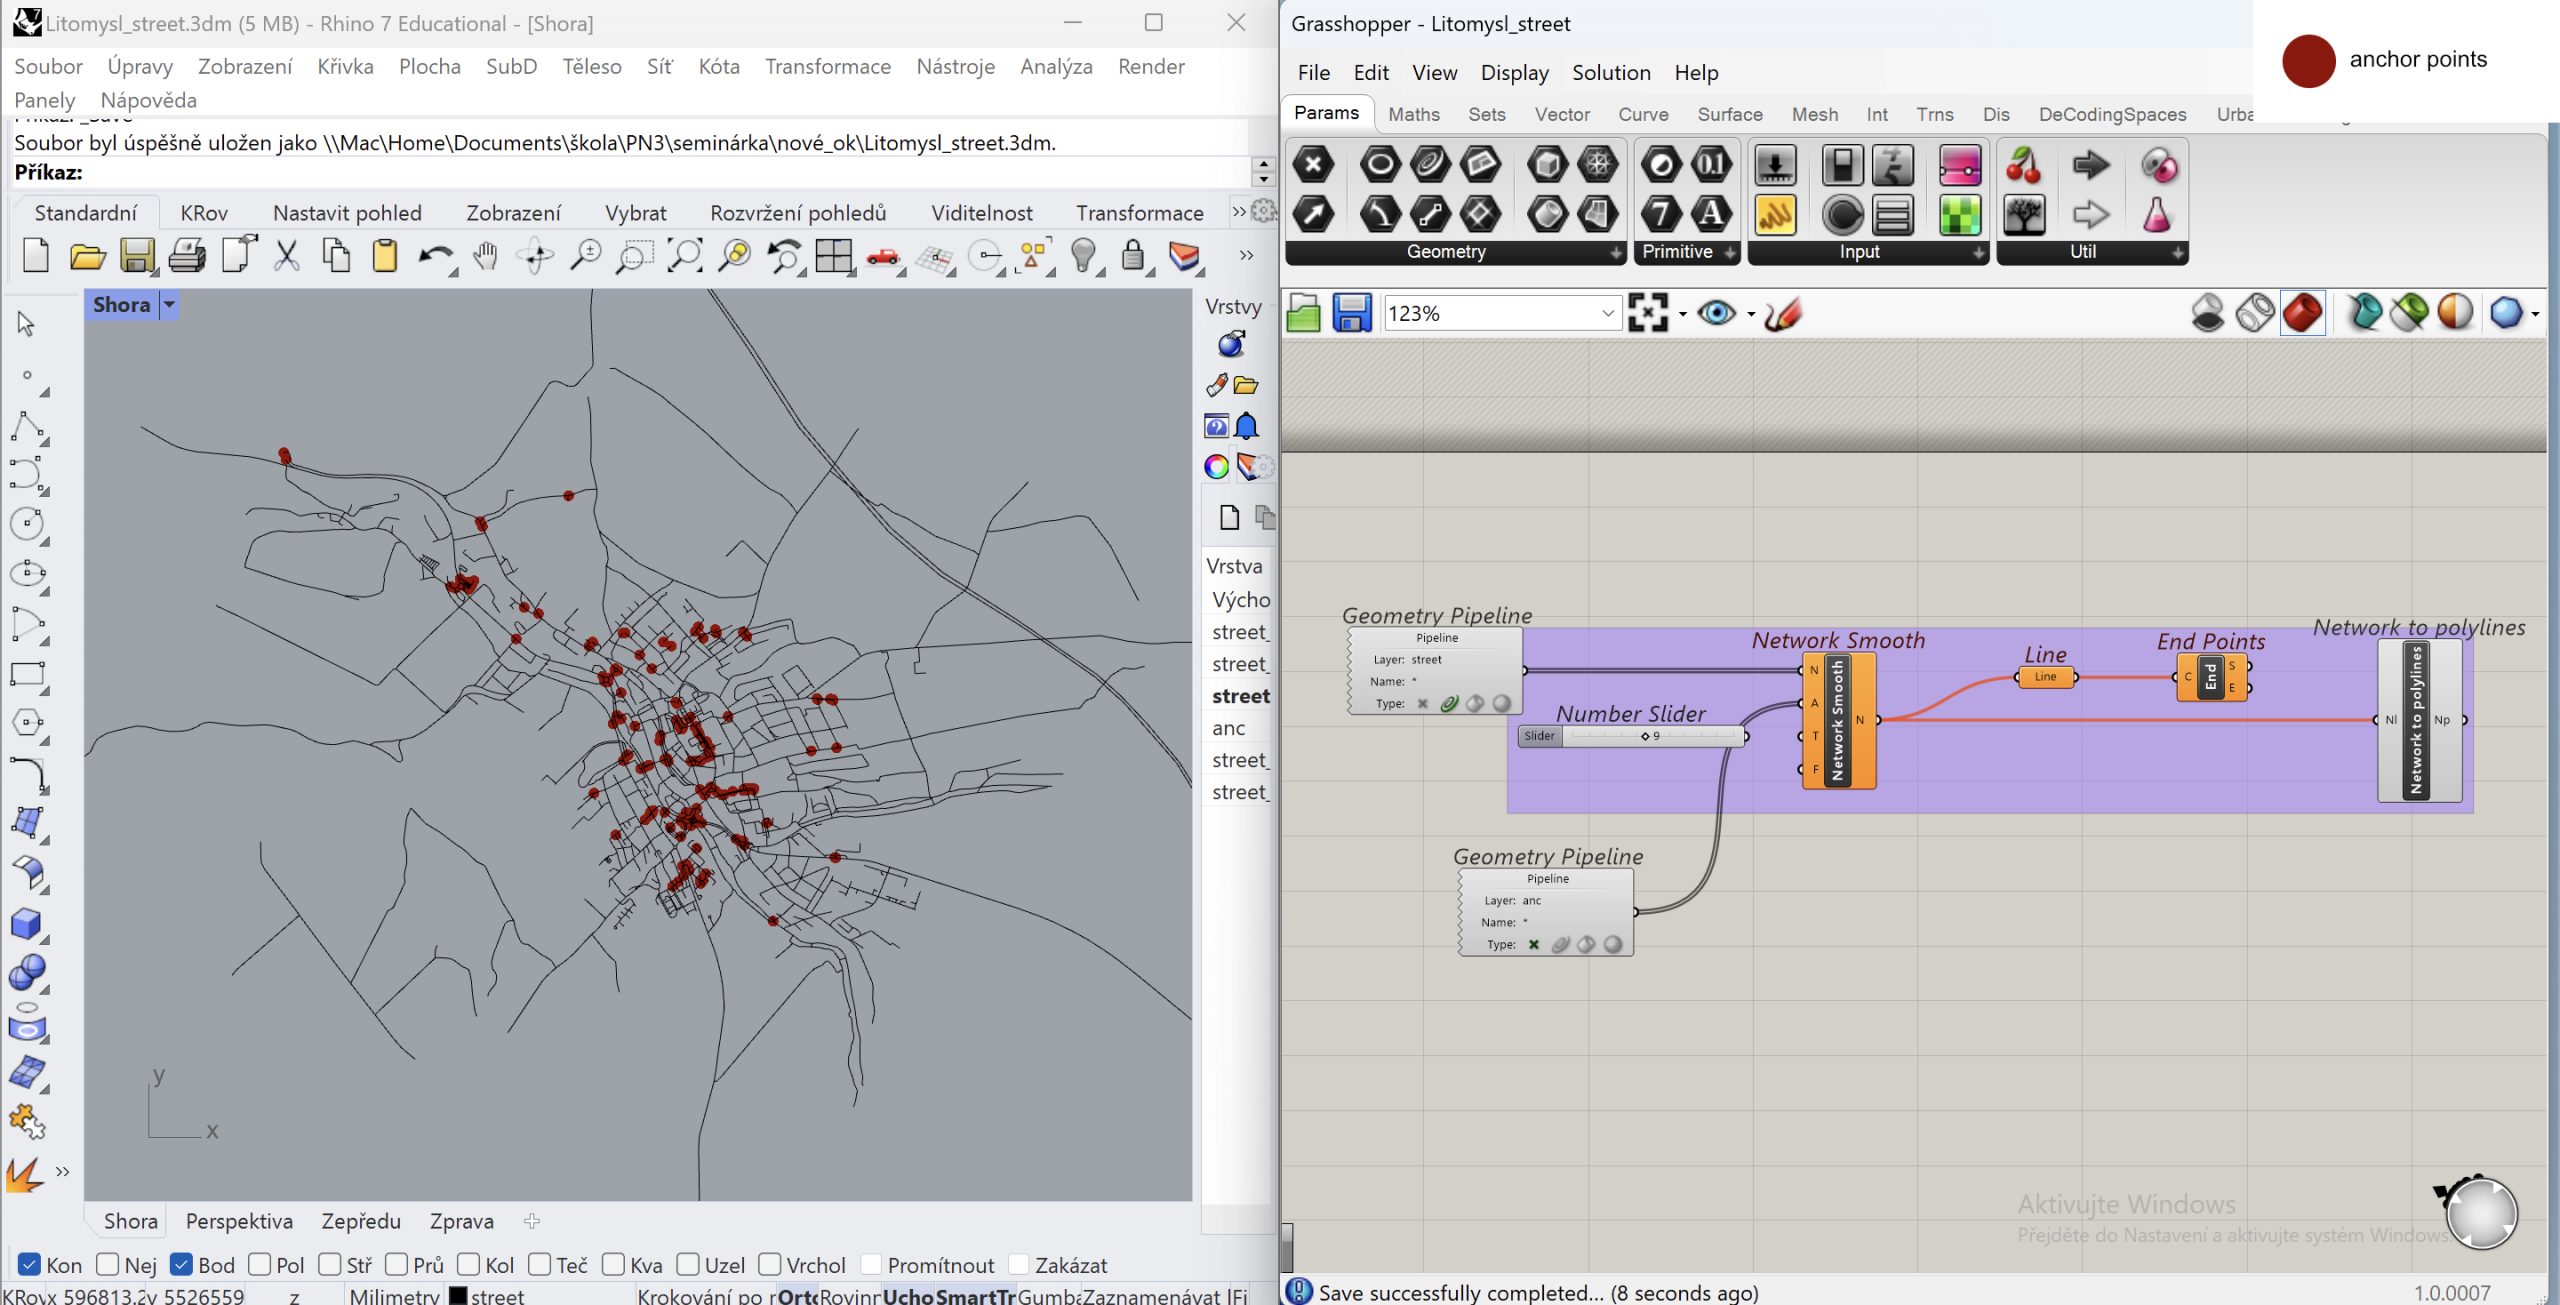
Network smooth
After importing data I baked them, so it would be a little bit faster. For the analysis, it’s better if the data are less segmented, so I tried to smooth them with the Network Smooth tool as much as possible without influencing the result.
Sometimes it can connect some dead-end streets, or streets that are close to each other. To avoid this from happening I put there anchor points, for the places that I didn’t want to change. I had to do it a few times to avoid any mistakes in the final street network.
Smoothing the data itself took about 9 hours of counting. When it was finished, I baked the data again, so the analysis would be faster.
Betweenness centrality
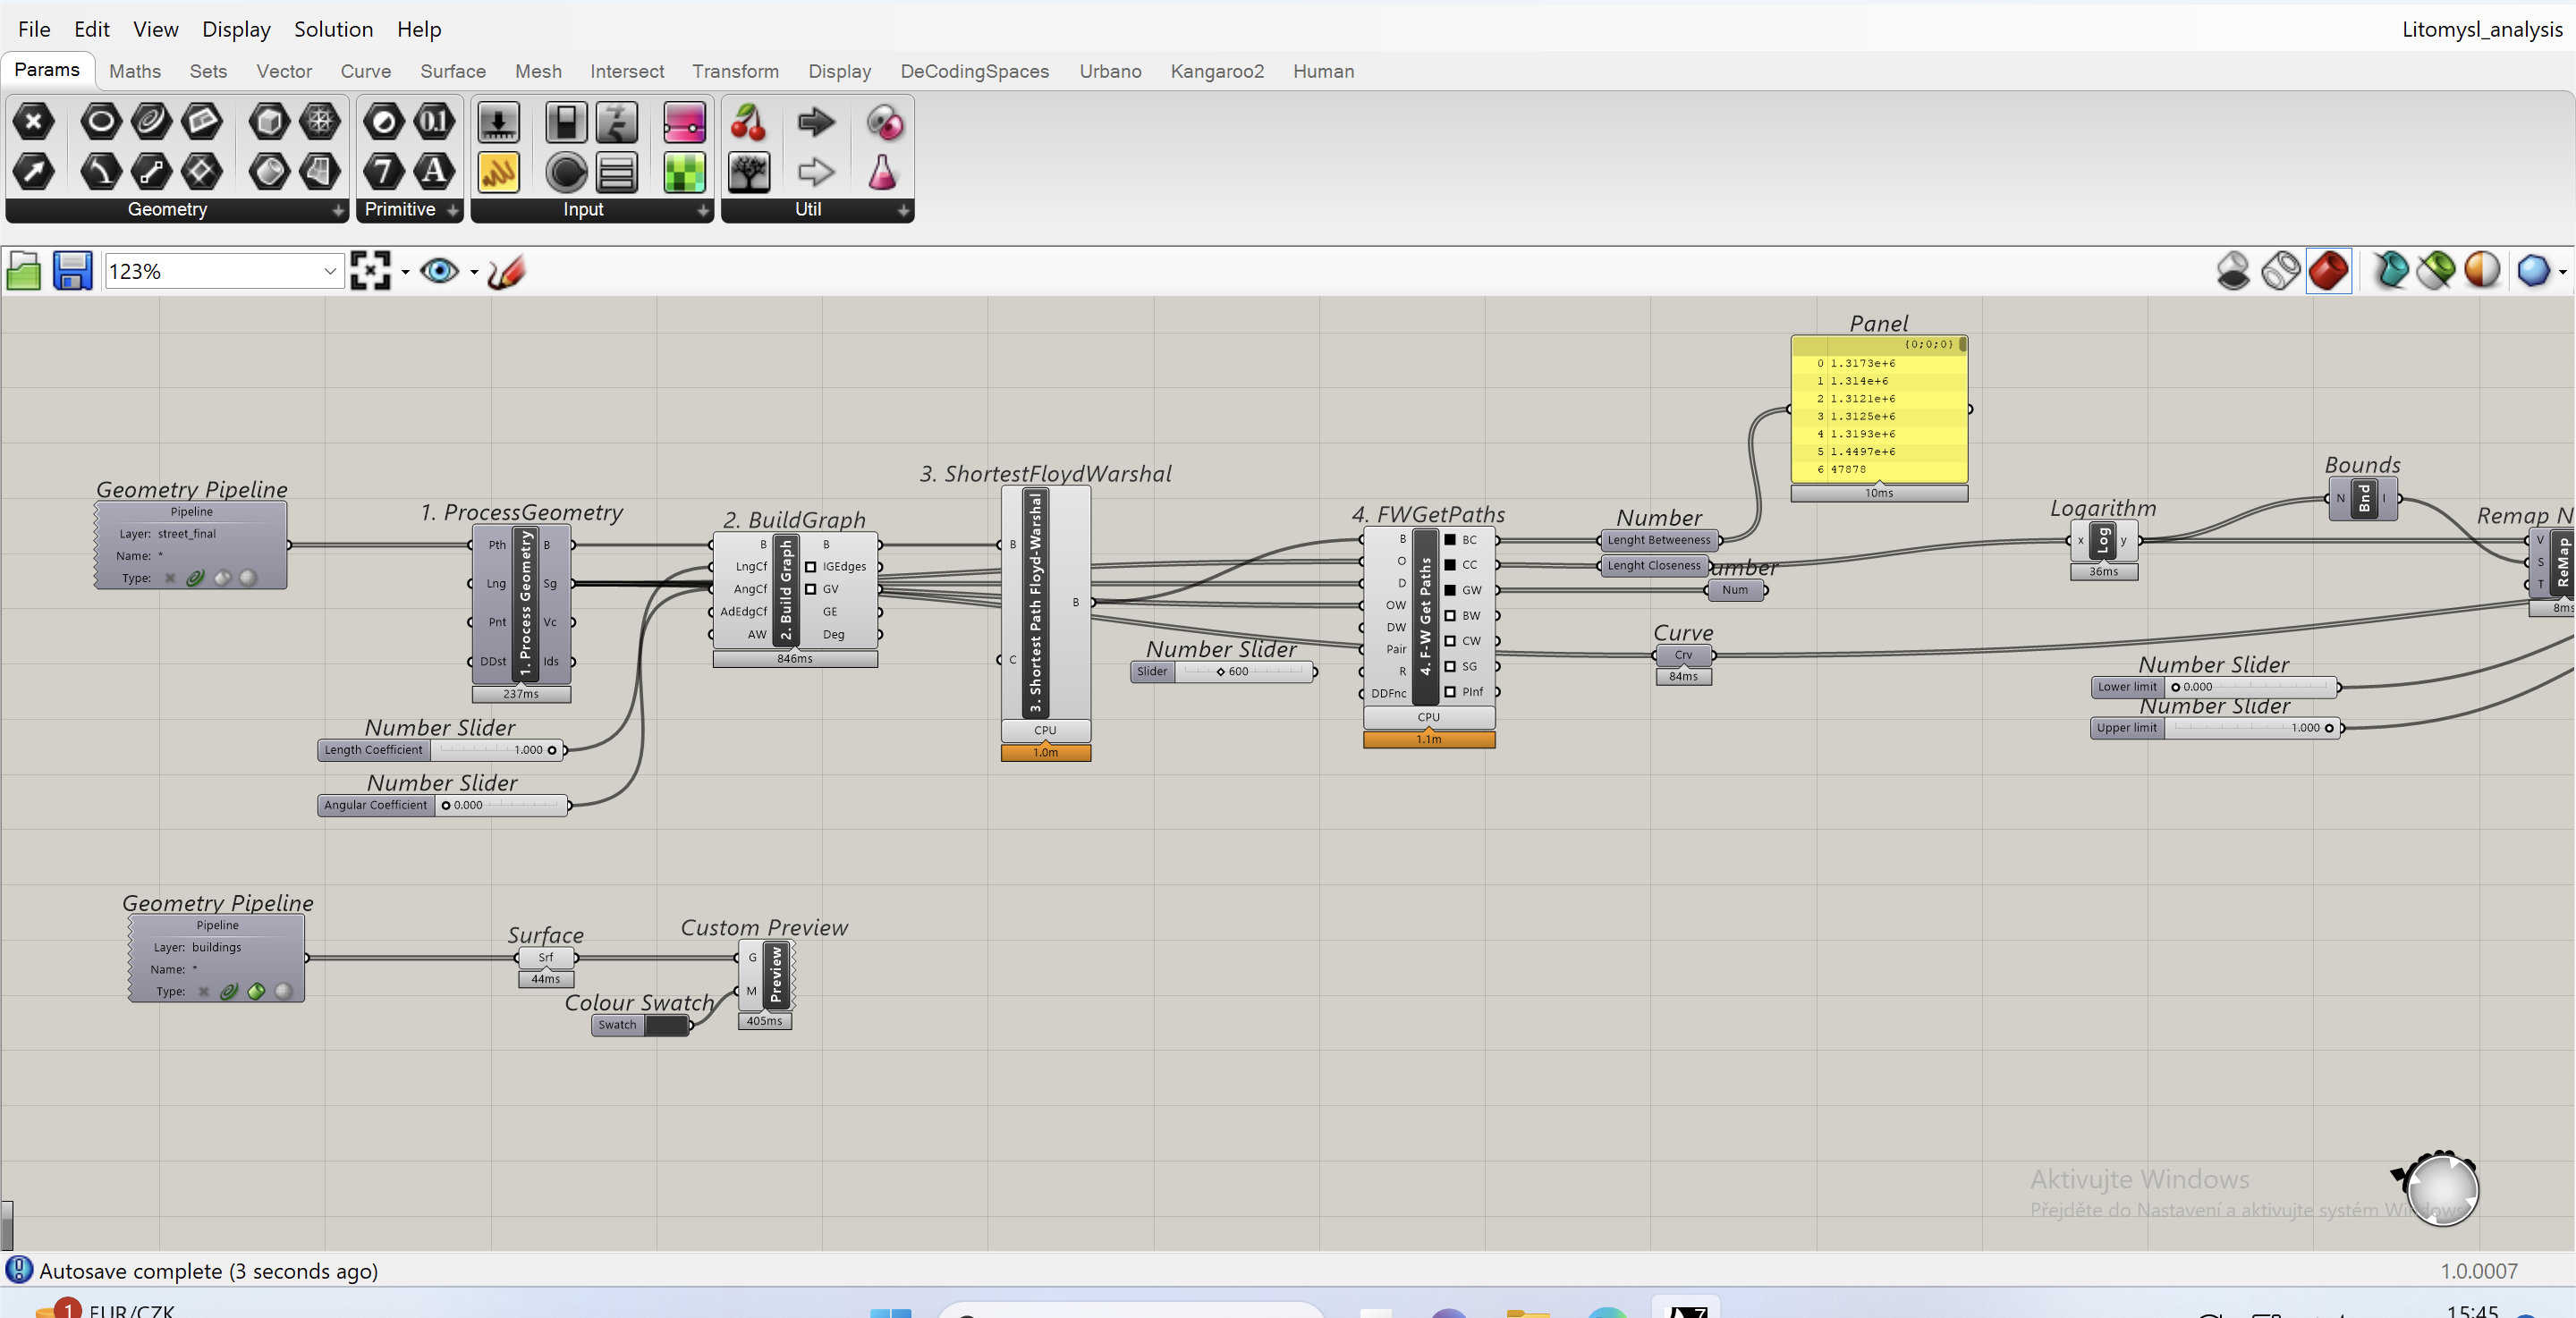
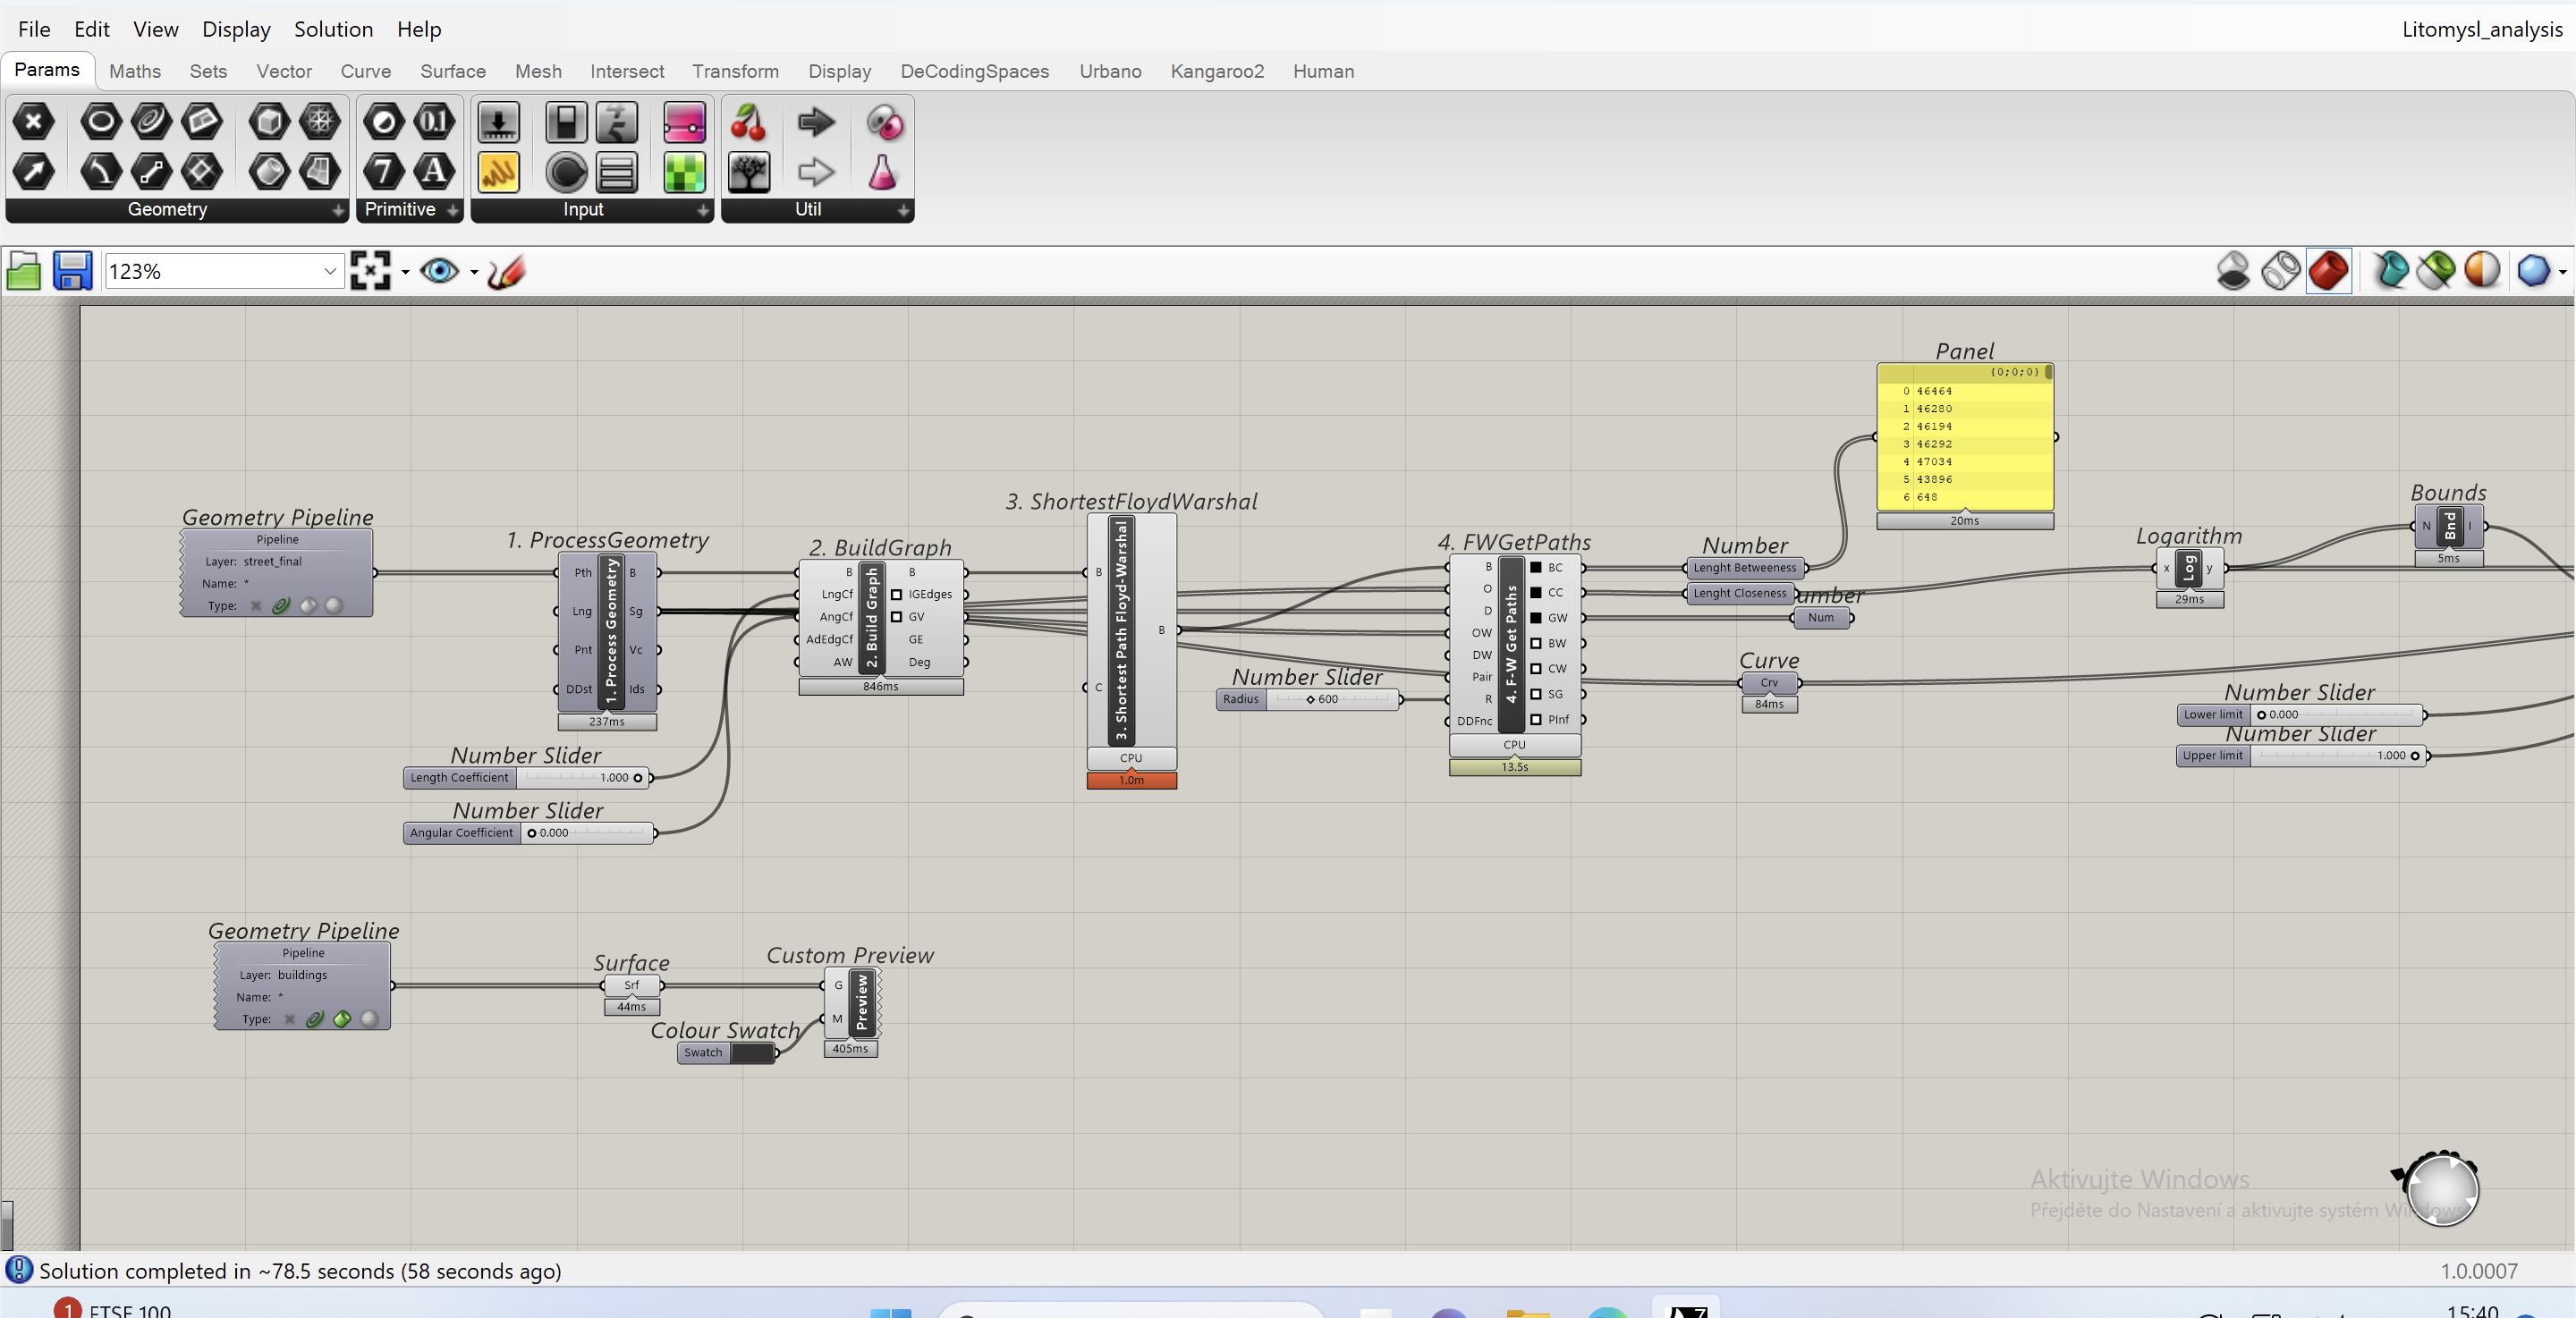
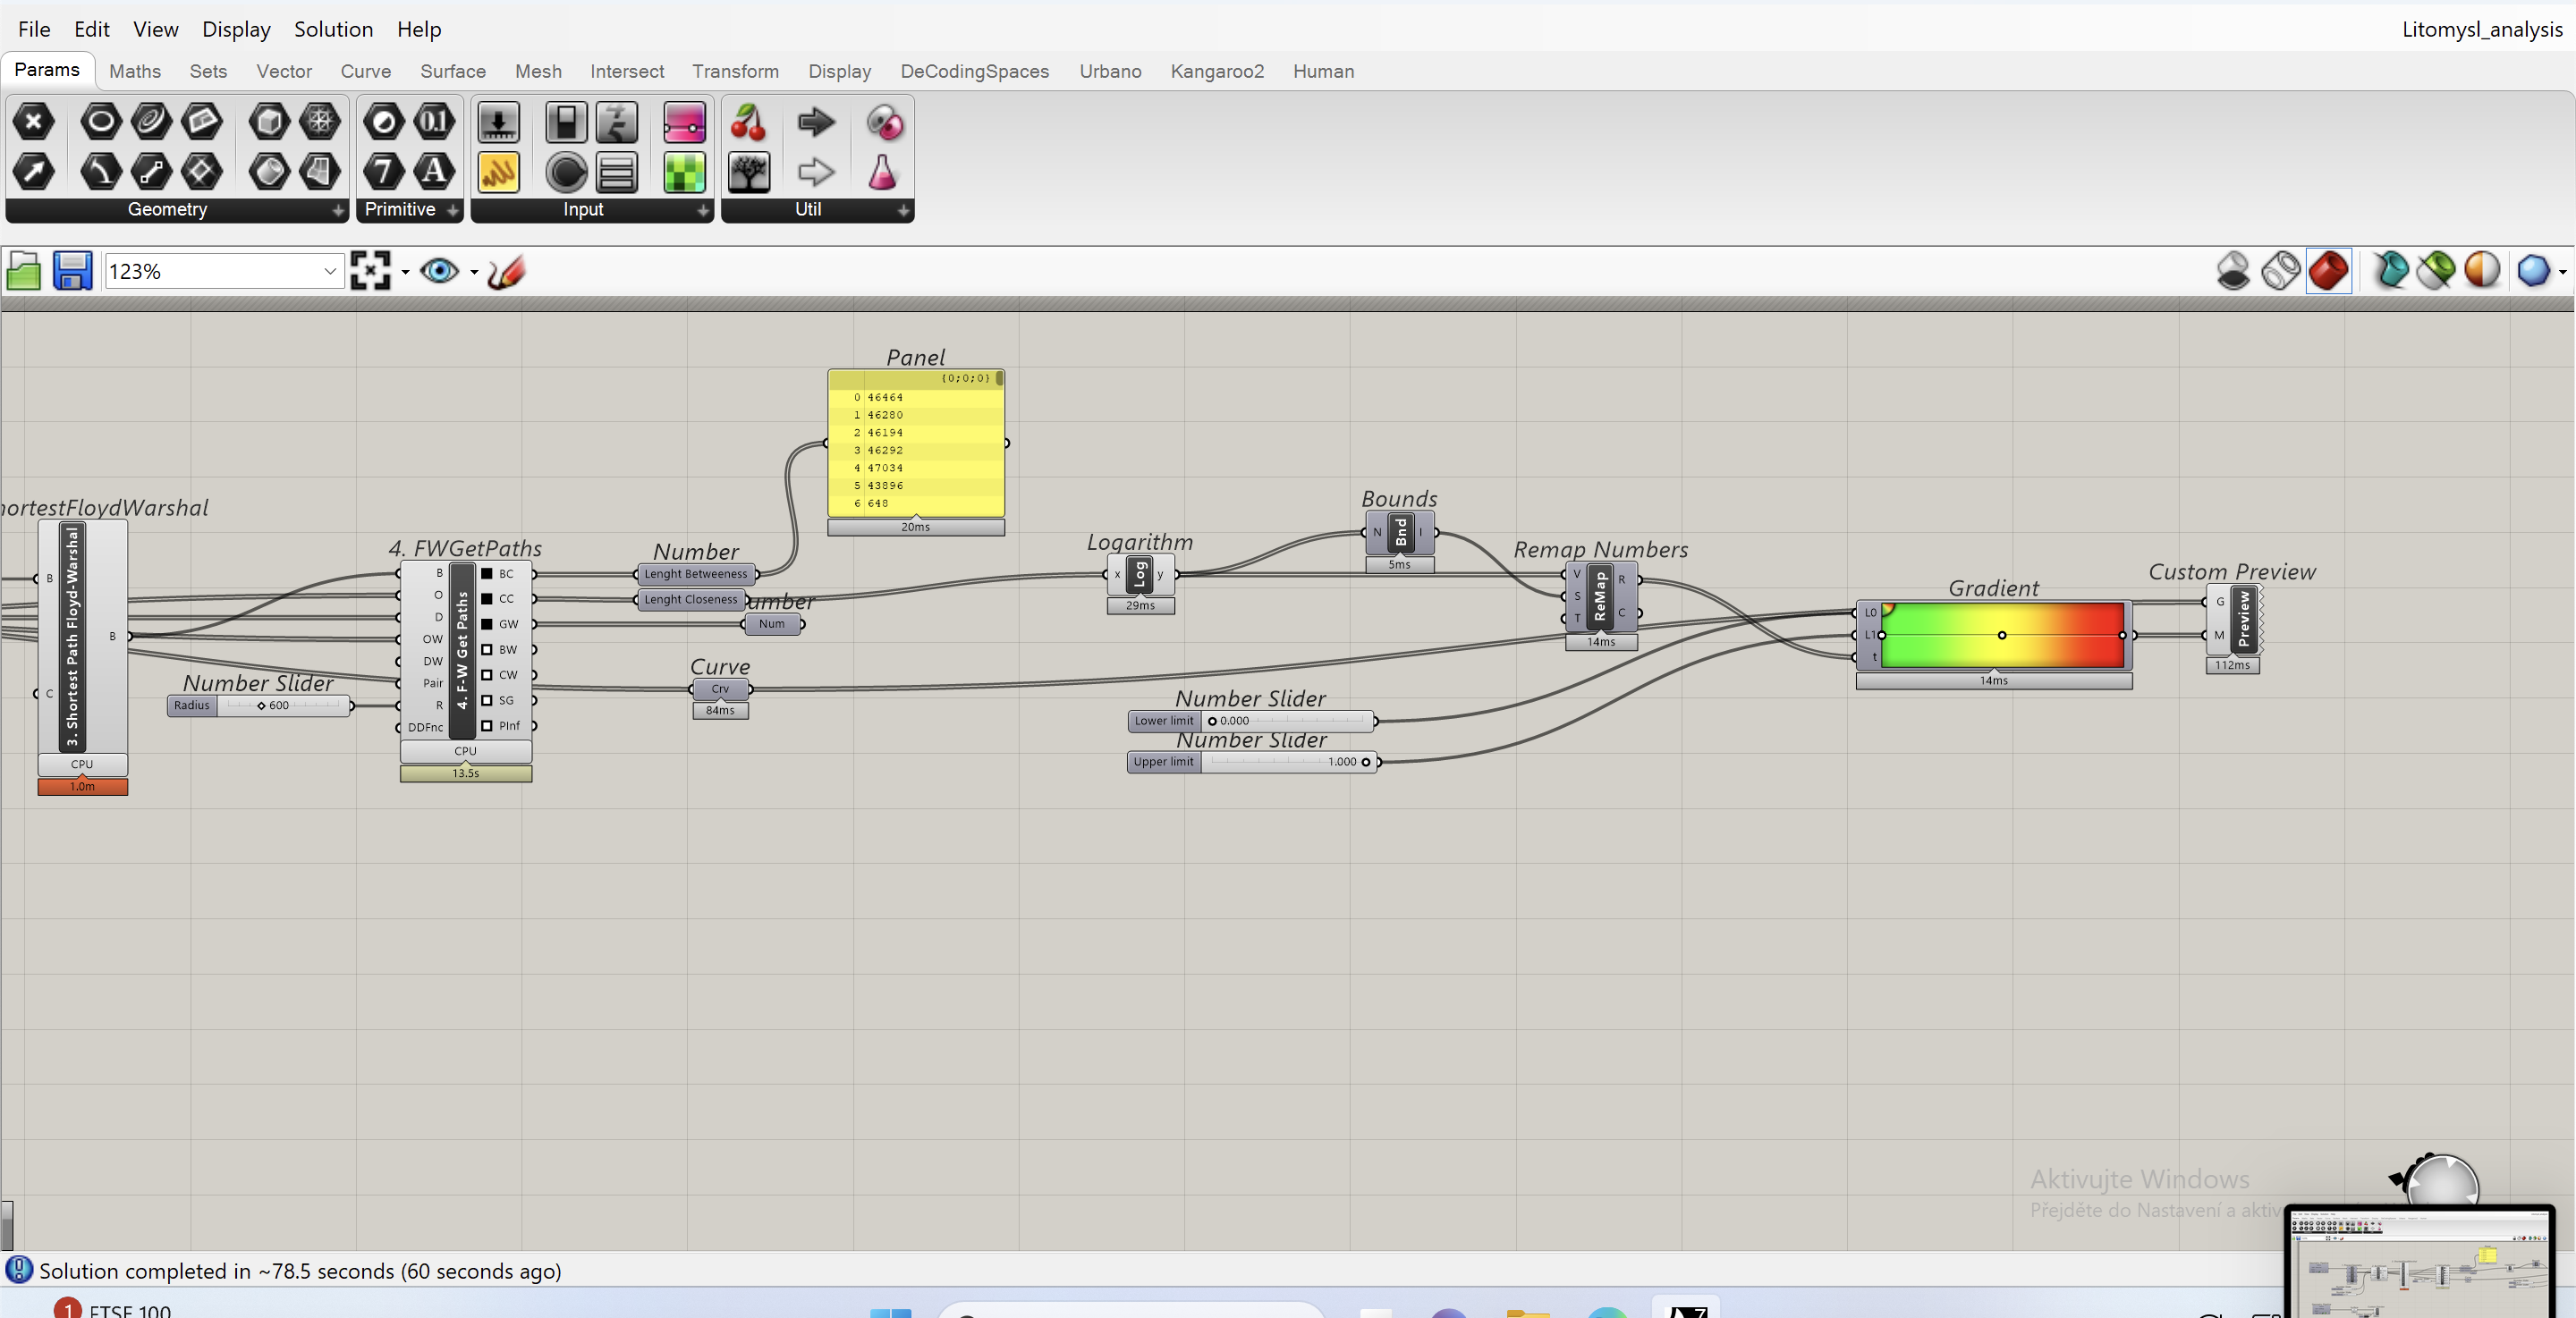
For the analysis, I used the tutorial, which is available directly on the website of the plug-in. You can change the analysis itself in the FWGetPaths tool.
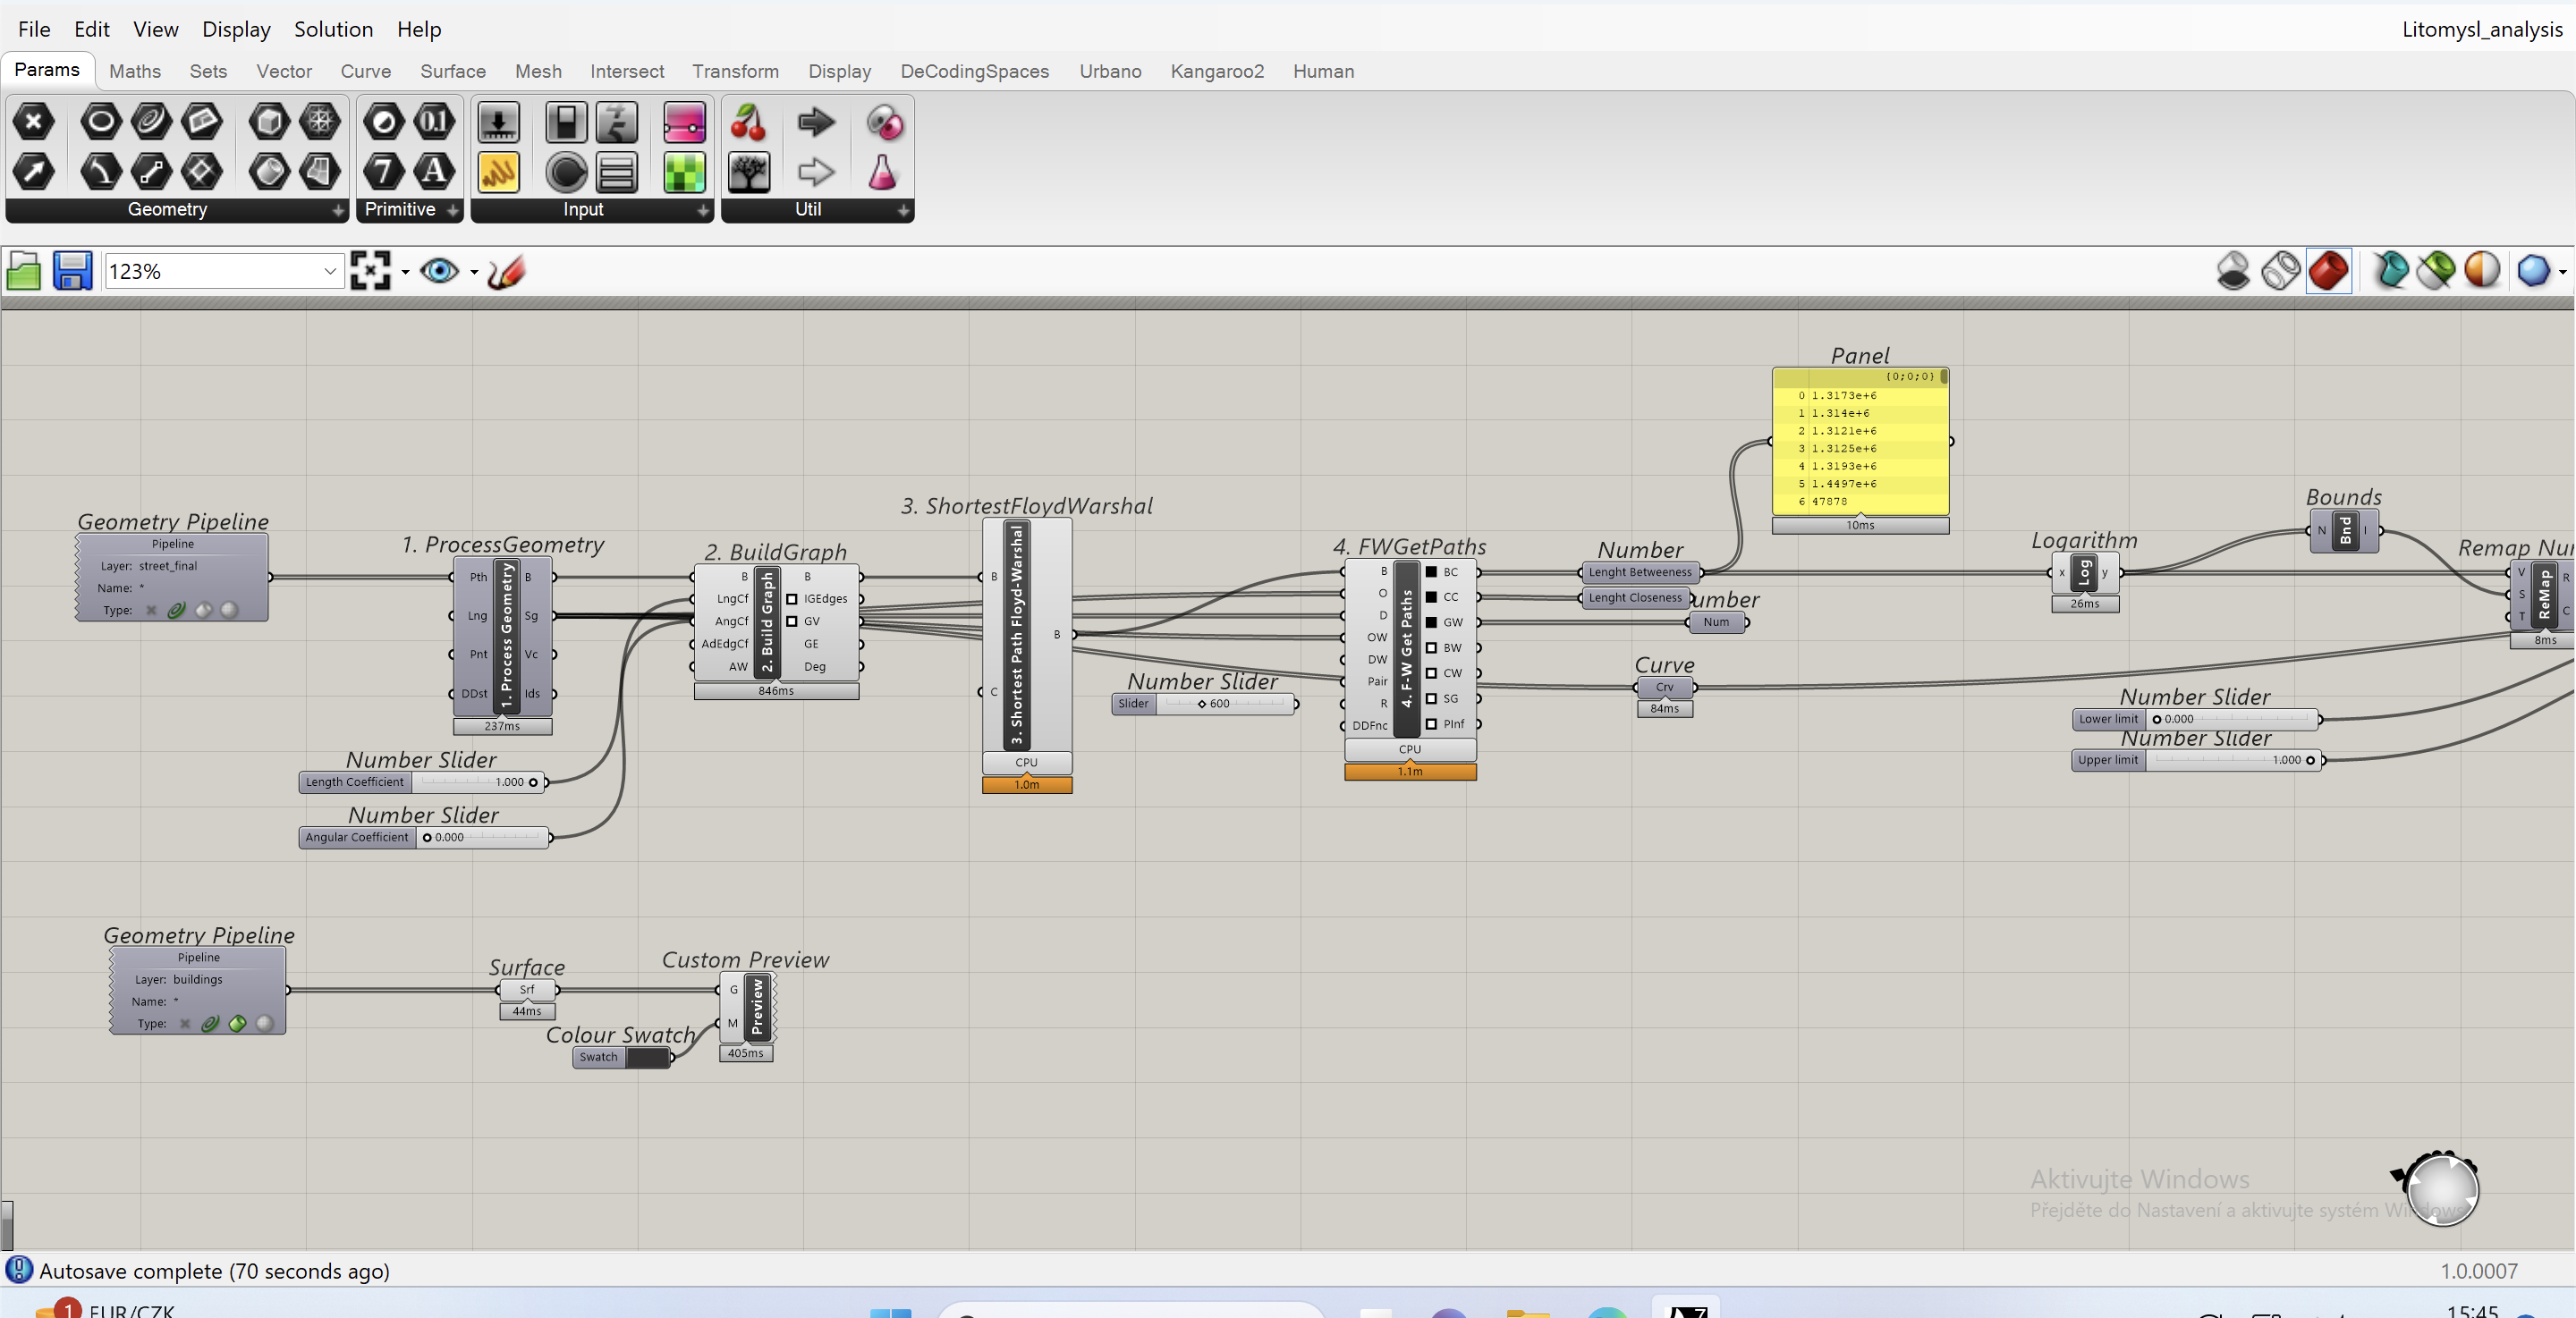
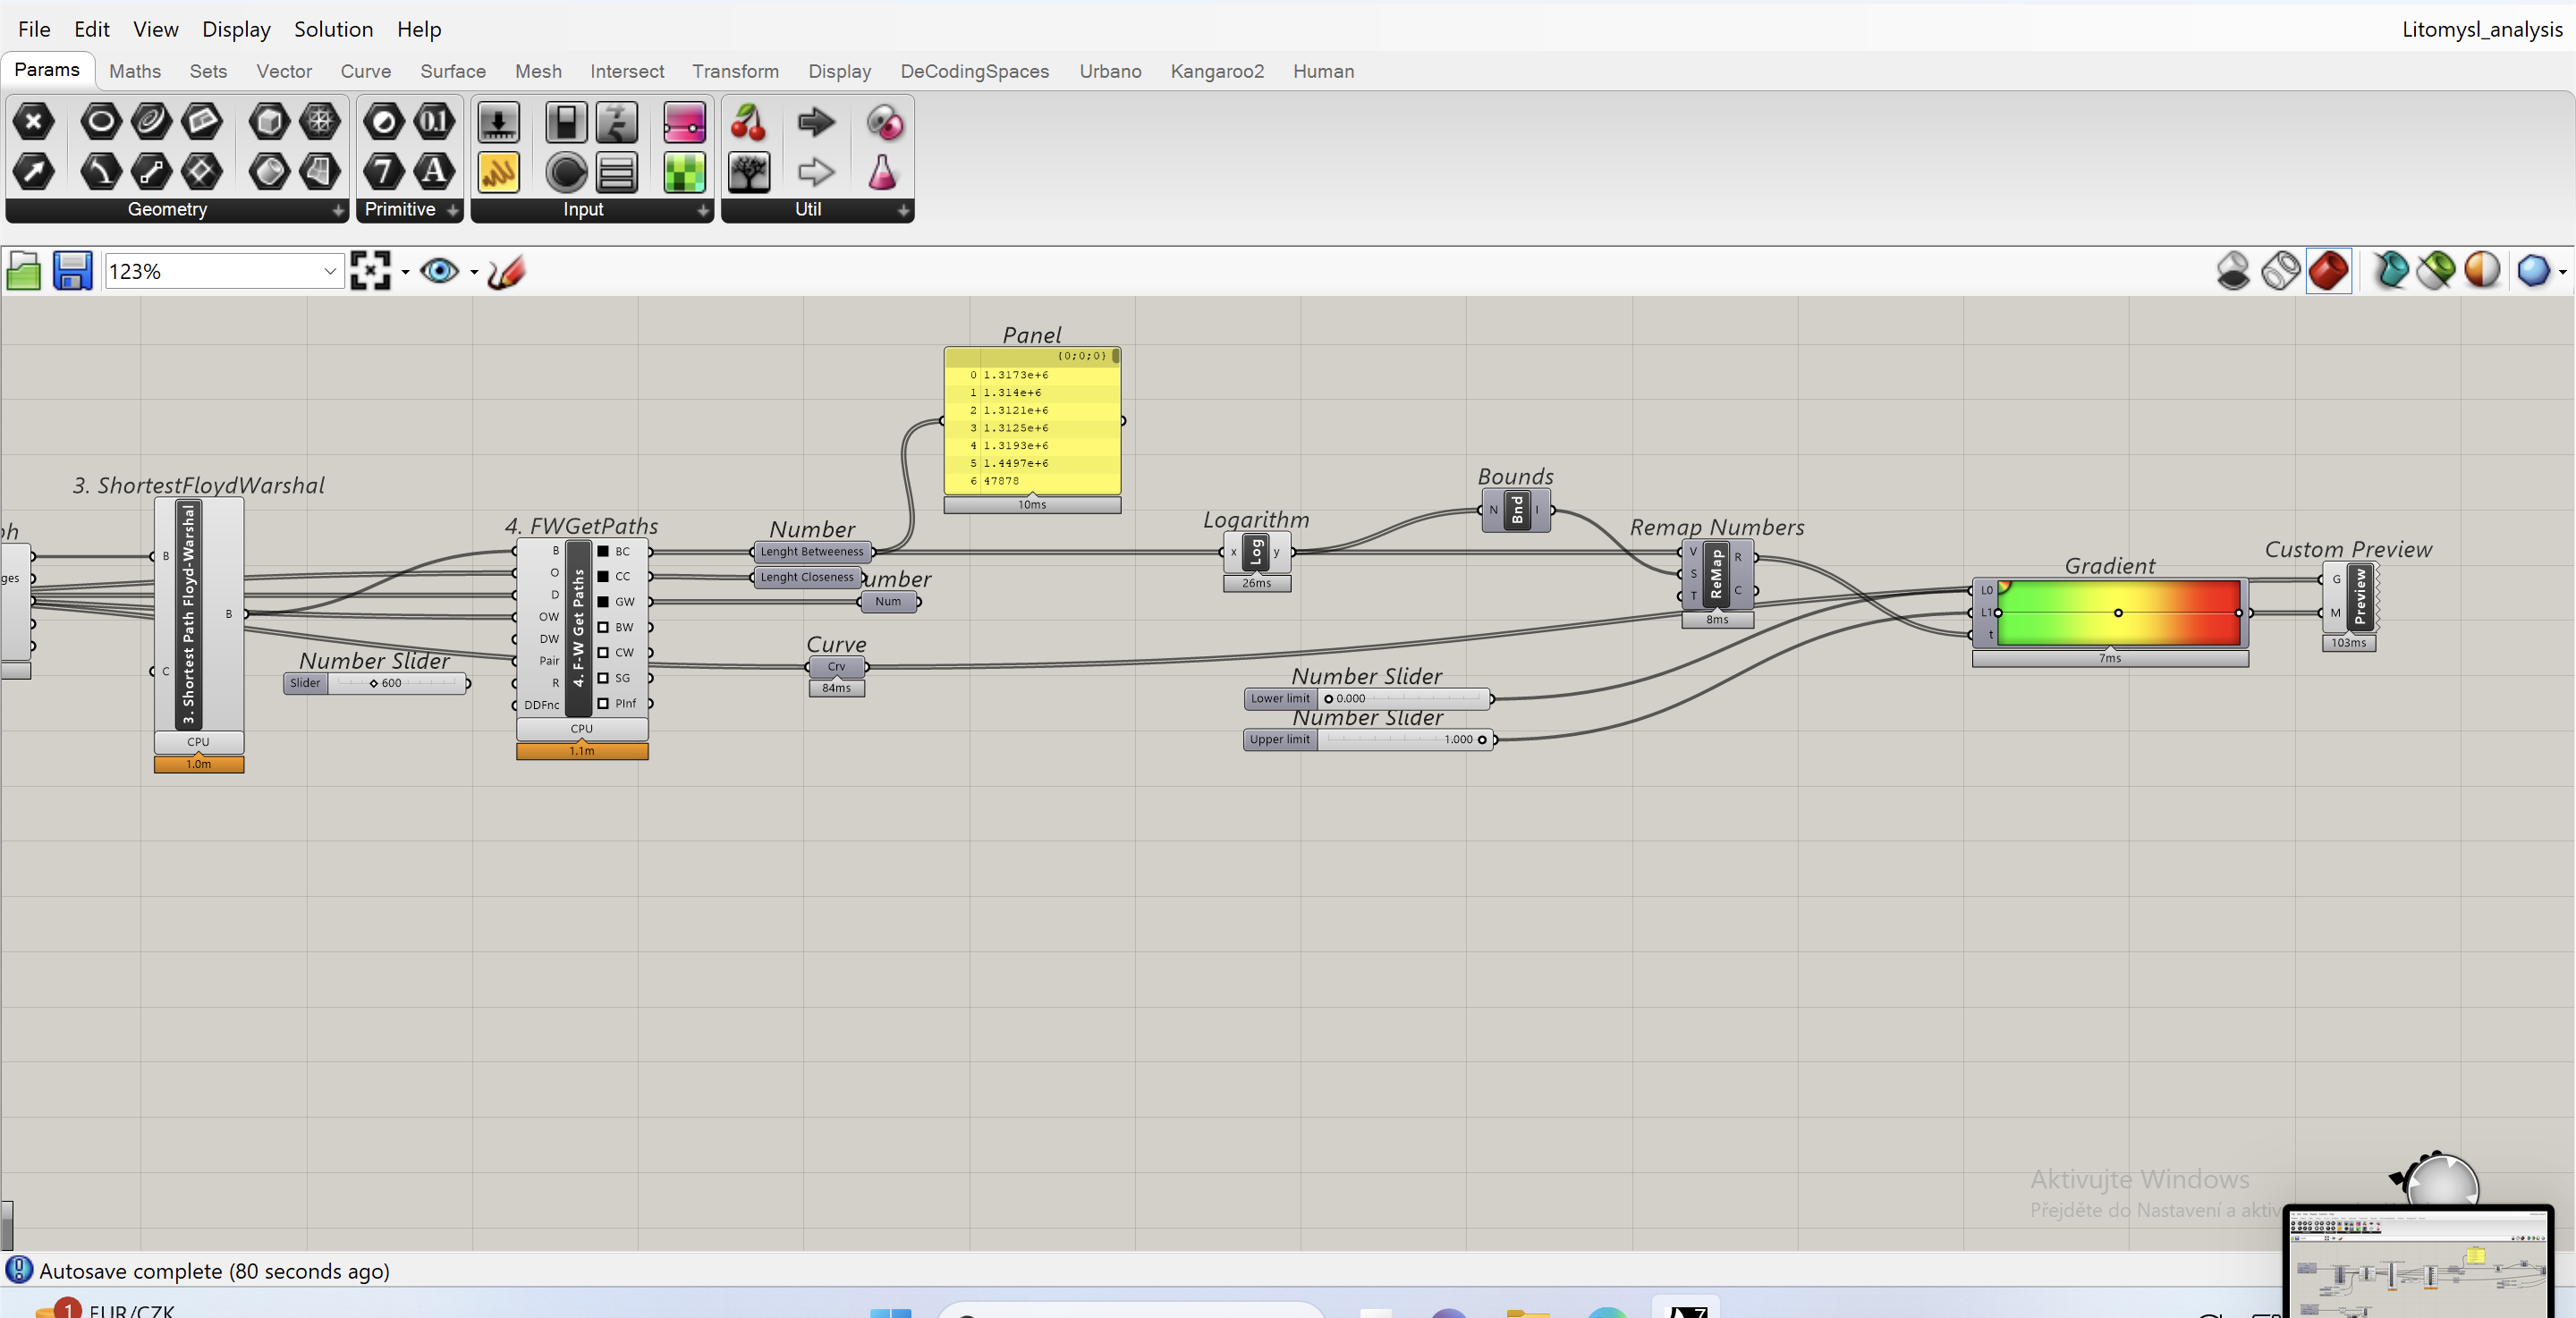
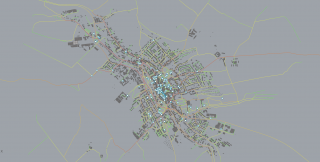
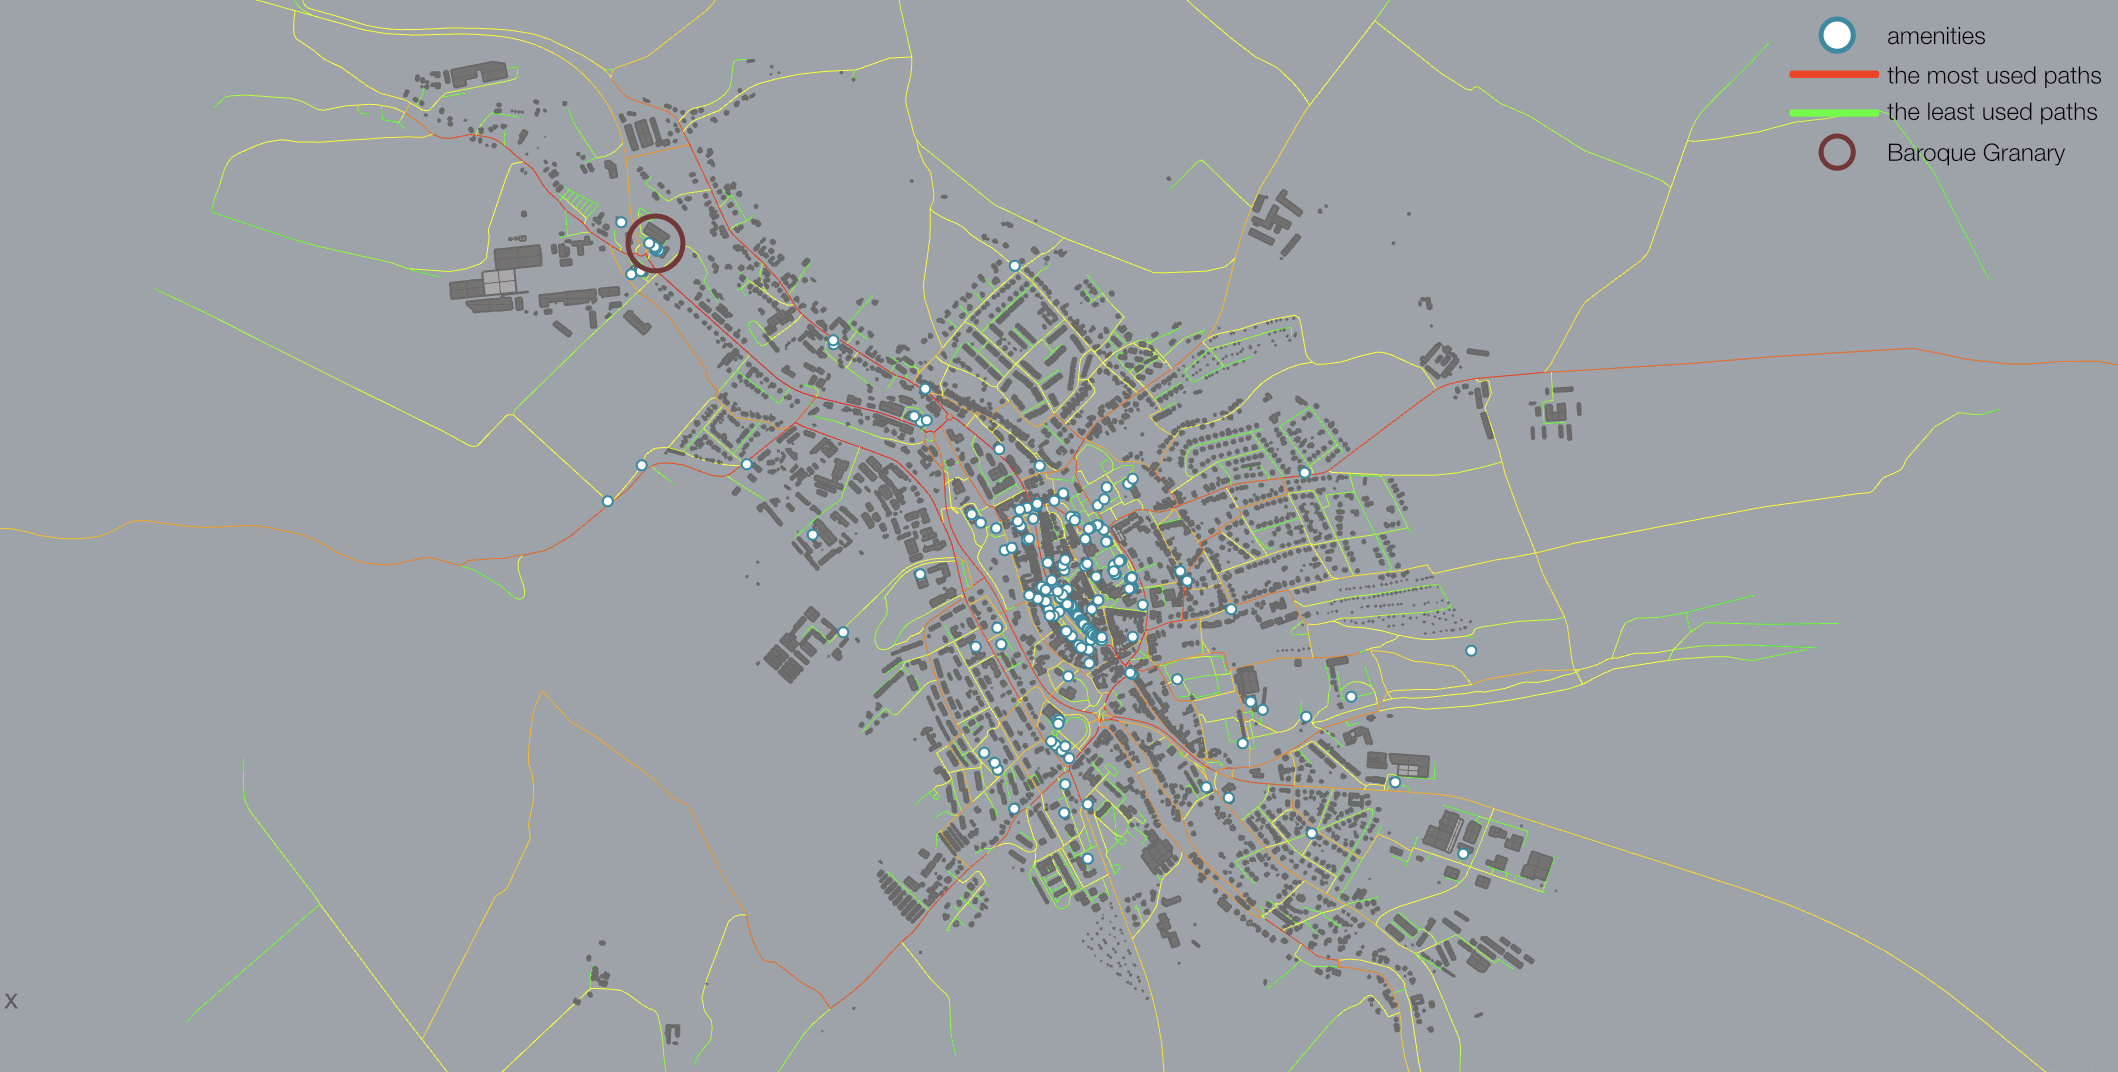
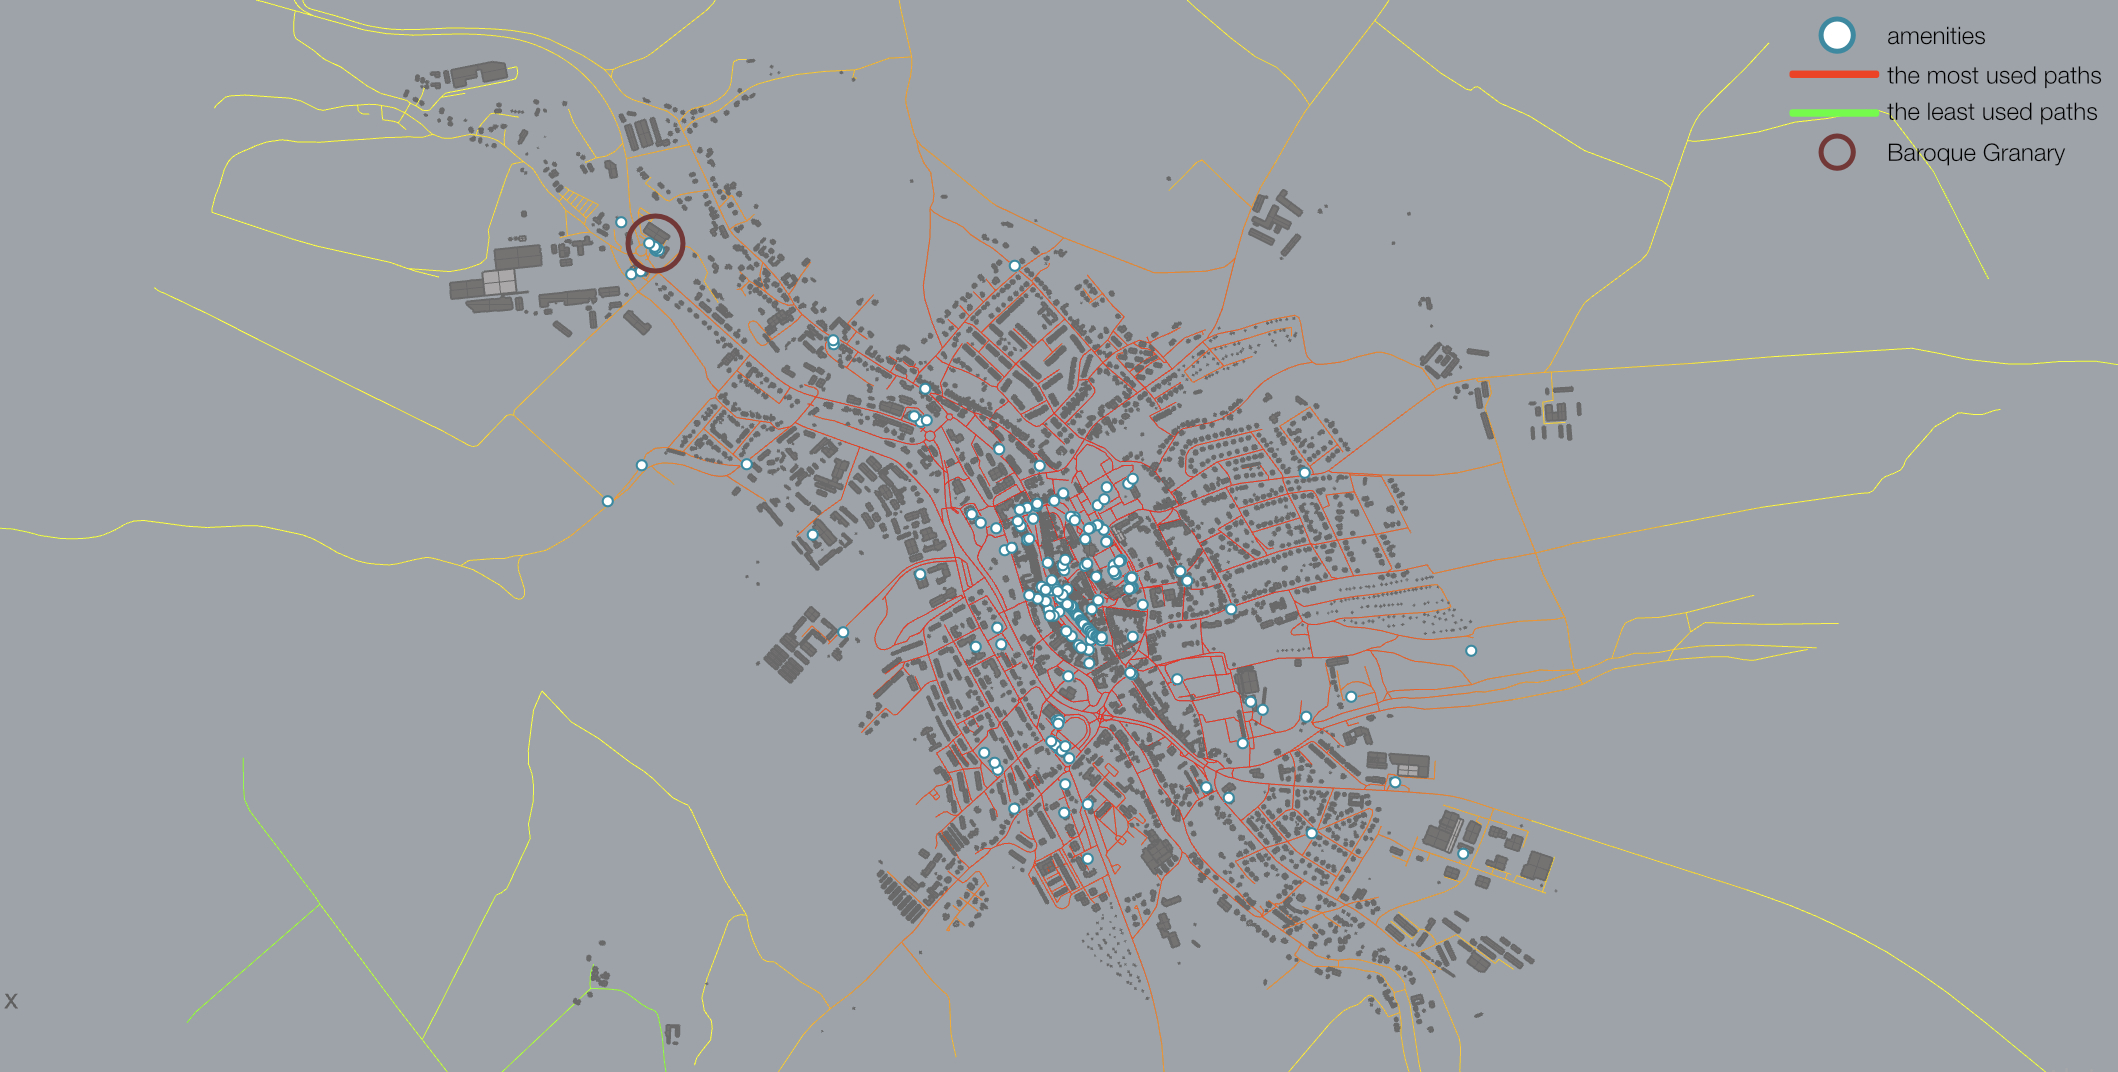
Final output of Betweenness centrality
Closeness centrality
For closeness centrality I used the same data and script, only switching the type of analysis in the FWGetPaths tool.
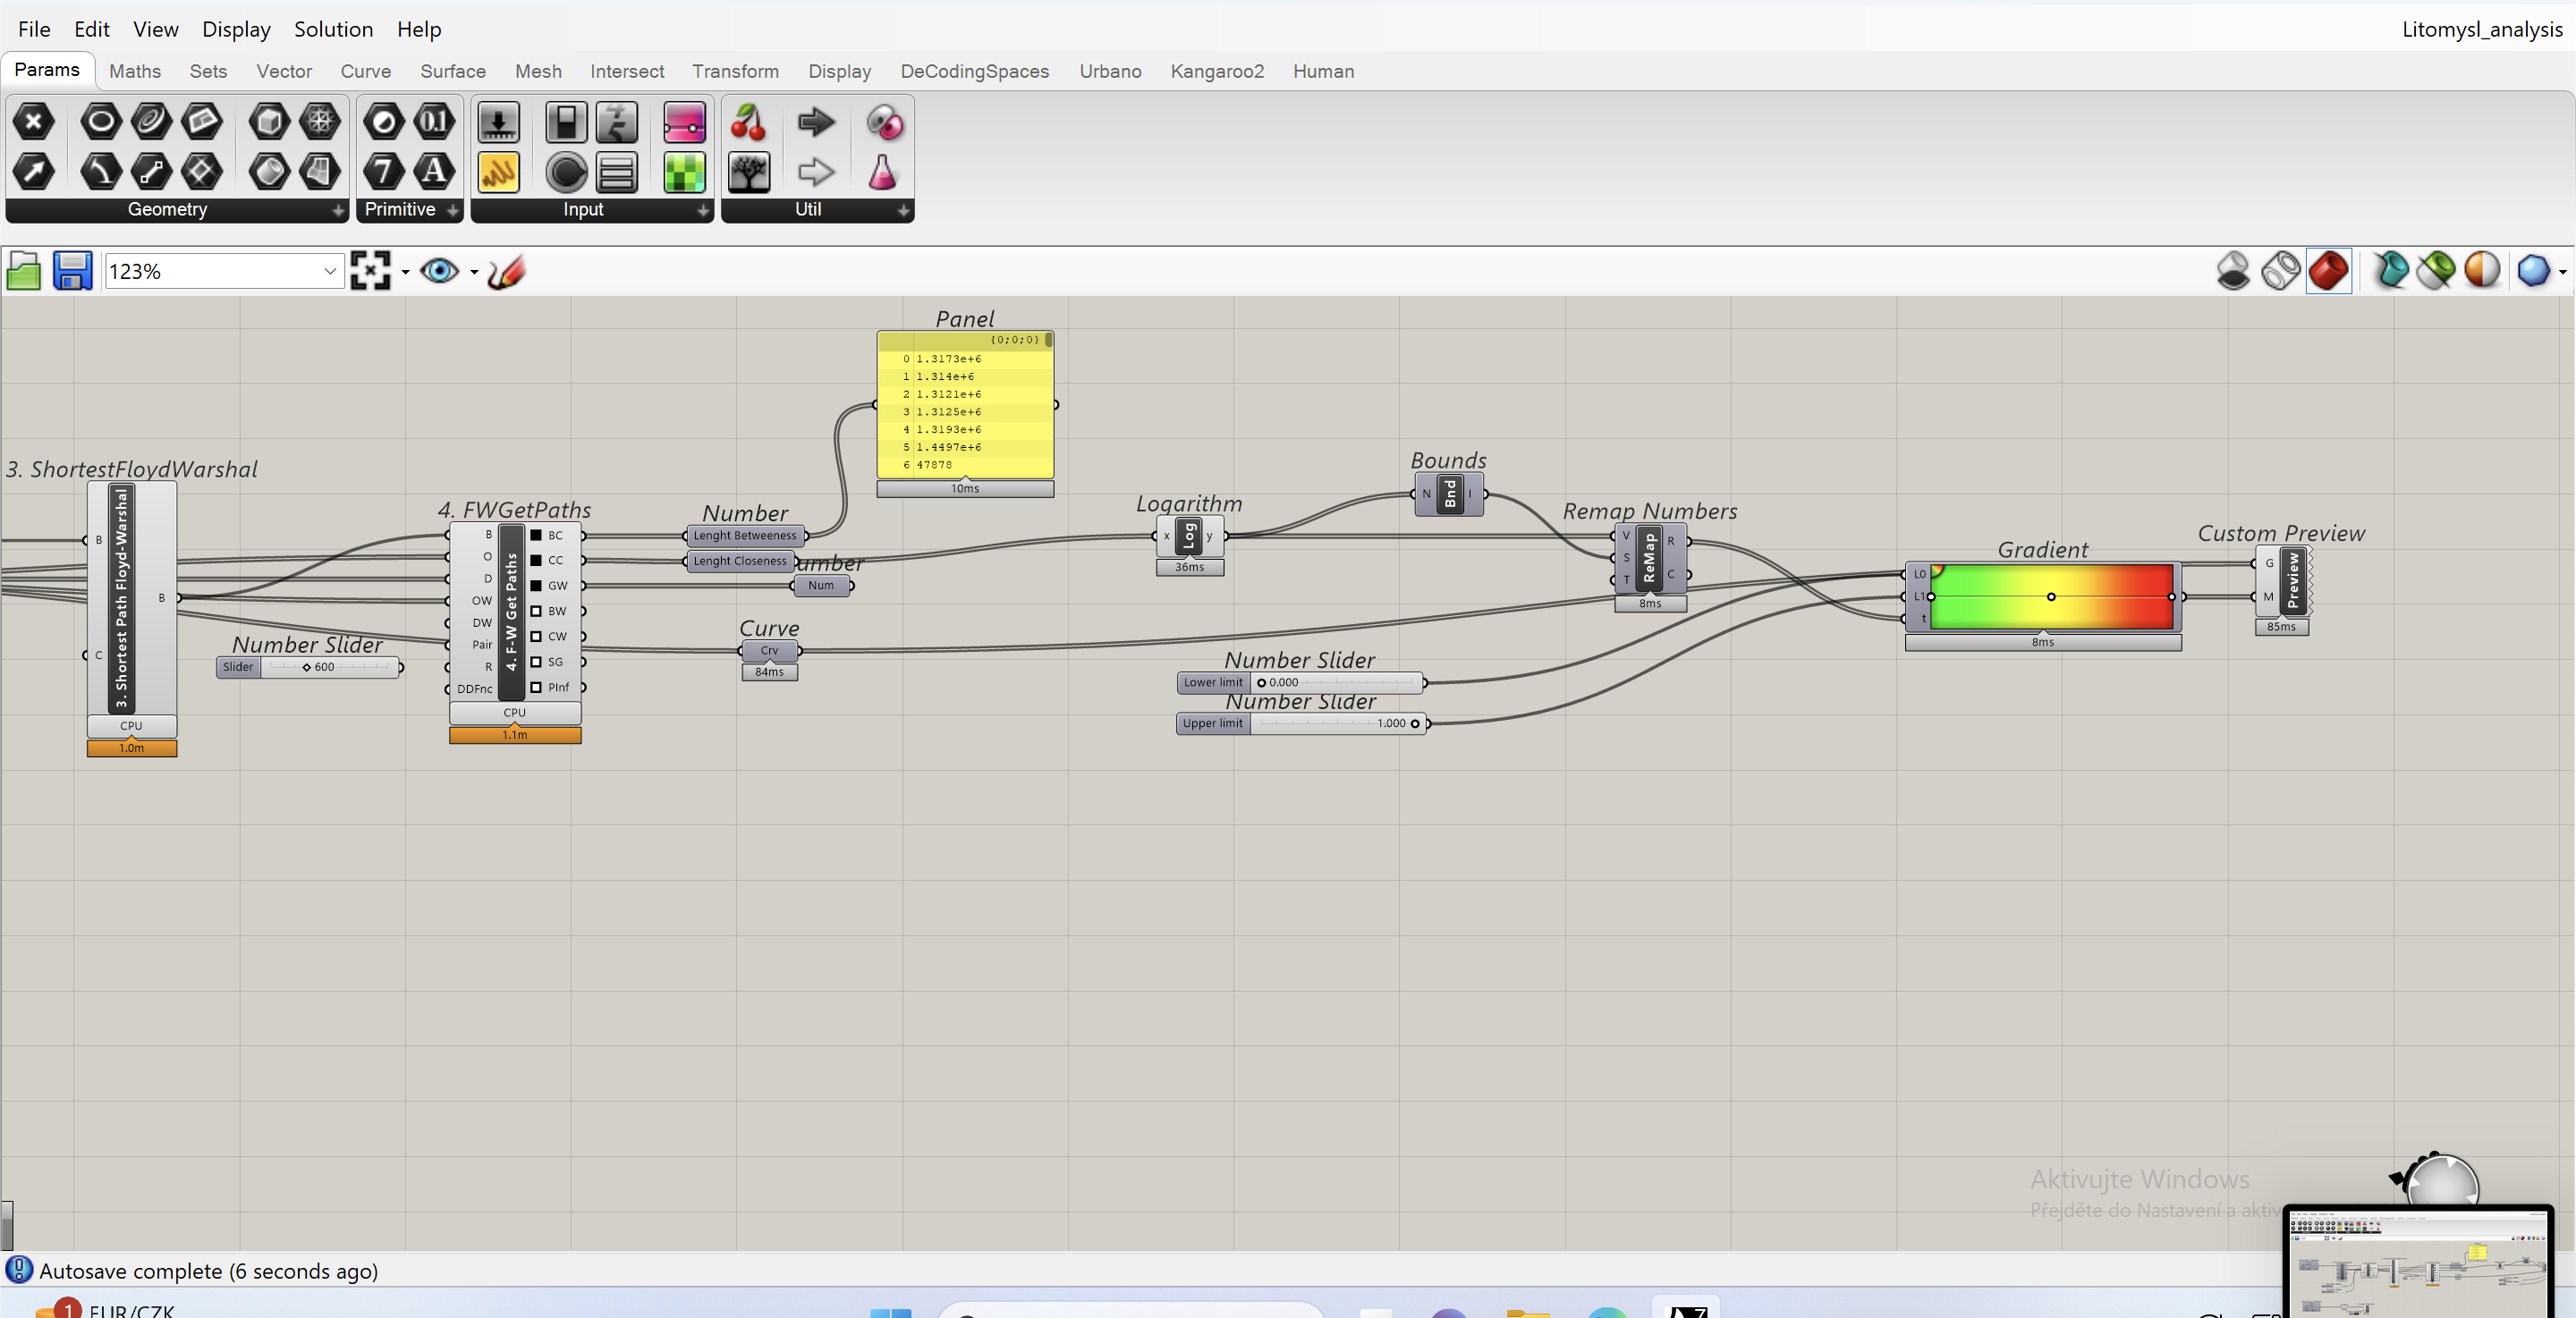
Final output of closeness centrality
You can change the walkable distance (radius) by putting a slider to R in the FWGetPaths tool.
Final output of closeness centrality R600
Conclusion
I more or less expected the results of the analysis, probably because I studied in Litomyšl and it is a relatively small town, so the results could be predicted. Still, the result is important for me, because I can assume a result, but I still need to back it up for the analysis.
The analysis itself is not difficult to prepare and calculate. The actual data preparation and curve smoothing are much more complex and time-consuming. Calculating the analysis in my case took a few minutes, but there is a difference if you are working with a smaller city and therefore fewer roads than if you are analyzing a city ten times larger.
Resources
https://toolbox.decodingspaces.net/
https://vimeo.com/432821686?signup=true#
https://vimeo.com/432821653
Dogan, T., Yang, Y., Samaranayake, S., & Saraf, N. (2020). Urbano: A tool to promote active mobility modeling and amenity analysis in urban design. Technology| Architecture+ Design, 4(1), 92-105.