VIDEO DOWNLOAD LINK:Kampa_final_Chi
Intro
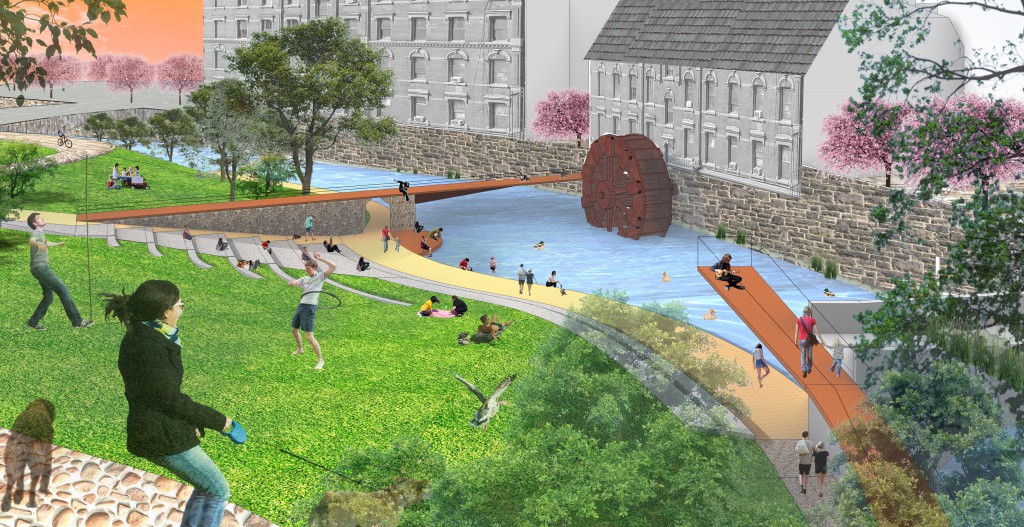
As the video shows, my design proposals point to the issue that we can’t experience water on Kampa island. Obviously viewing water plays a prominent role in interaction with water. I use parametric tool to analyse the current viewing conditions and compare it with the one after design.
_________________________________________________________________________________________________________________________________
Script
_________________________________________________________________________________________________________________________________
Isovist component
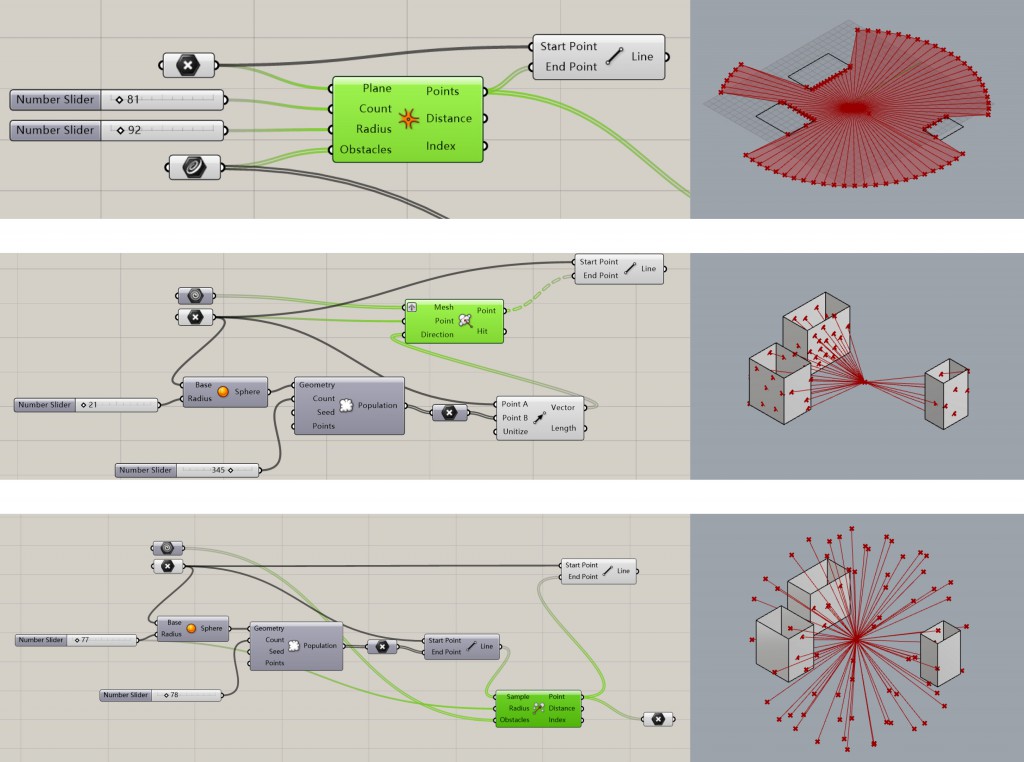
I tried three kinds of components for isovist as follows:
-1- Iso Vist is only in 2D.
-2- Mesh | Ray is difficult to set obstacles which means rays can penetrate meshes.
-3- Iso Vist Ray is both 3D and inclusive of obstacles which is suitable in this case.
______________________________________________________________________________________________________________________________________
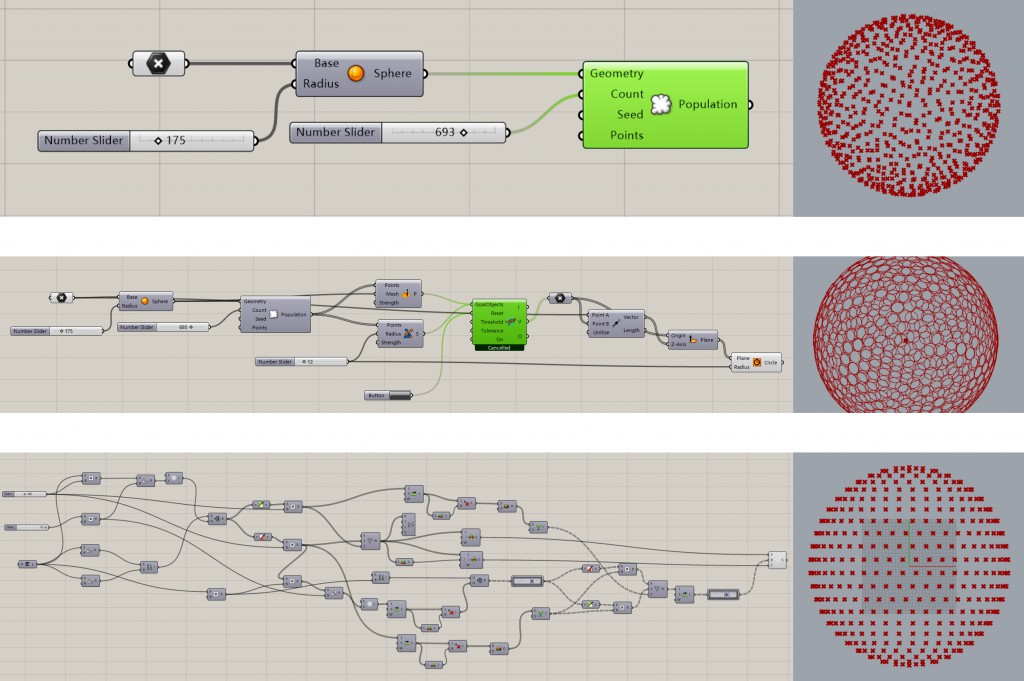
Uniform distribution of sight lines
I search the Internet and come up with three different ways to make it.
-1- Populate Geometry to generate random points on a sphere which could be similar to uniform distribution if the number of points is large.
-2- Populate geometry + Kangaroo Solver to adjust the points almost same as uniform distribution.
-3- Using geometry knowledge to generate points which is absolutely uniform distribution.
Because I will set a large number of sight lines which might take many time to calculate, I choose the first one.
______________________________________________________________________________________________________________________________________
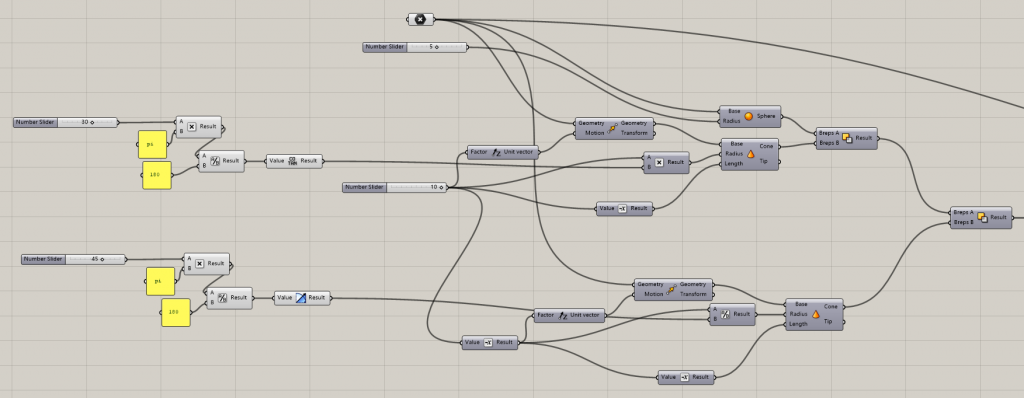
Angle of sight lines
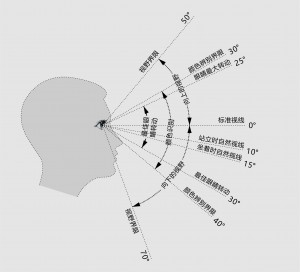
I use Solid Difference with two cones and a sphere to create a shape which determines the range of human sight.
______________________________________________________________________________________________________________________________________
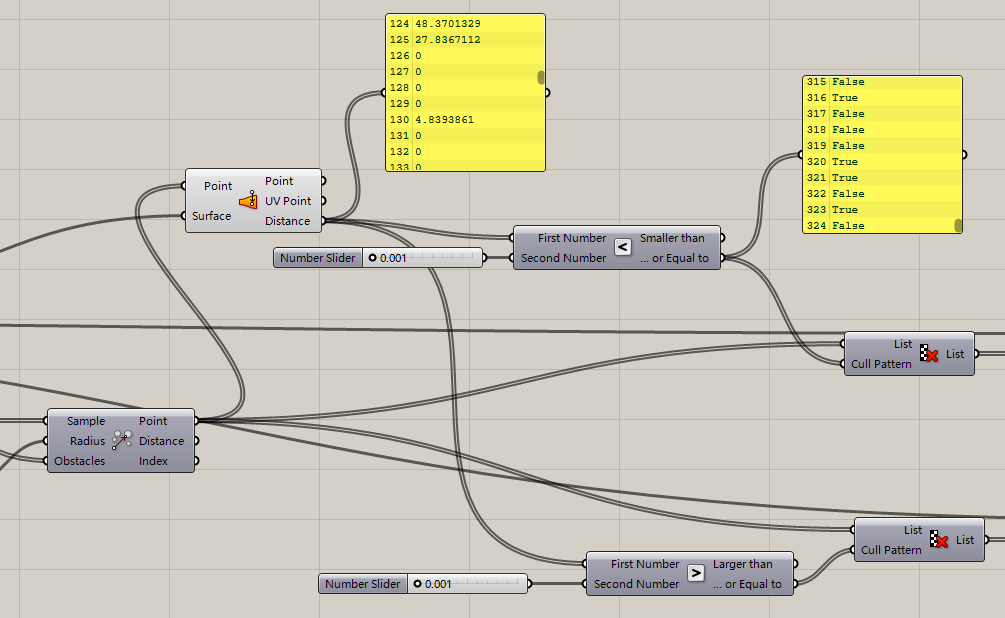
Select sight lines connect to the water
Using Surface Closest Point to select those sight lines which connect to the water.
______________________________________________________________________________________________________________________________________
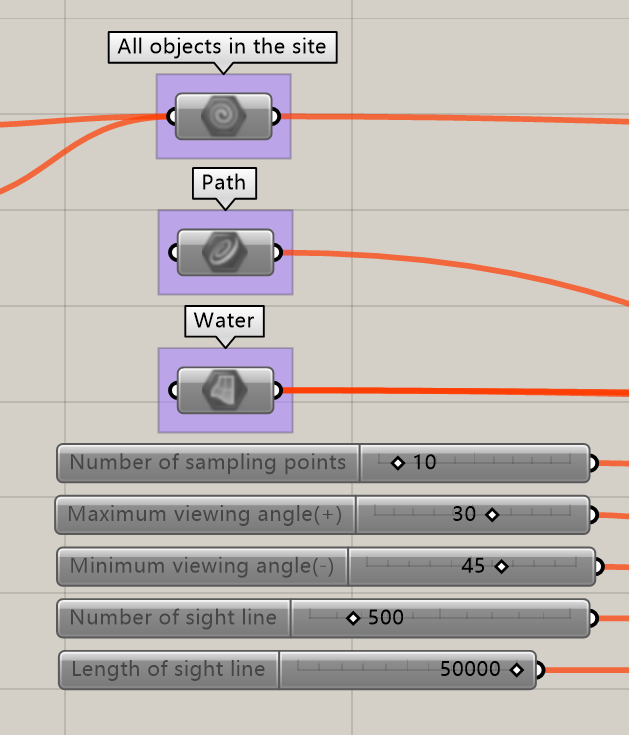
Input and output
______________________________________________________________________________________________________________________________________
Visualization results
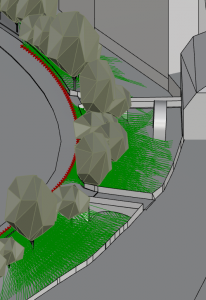
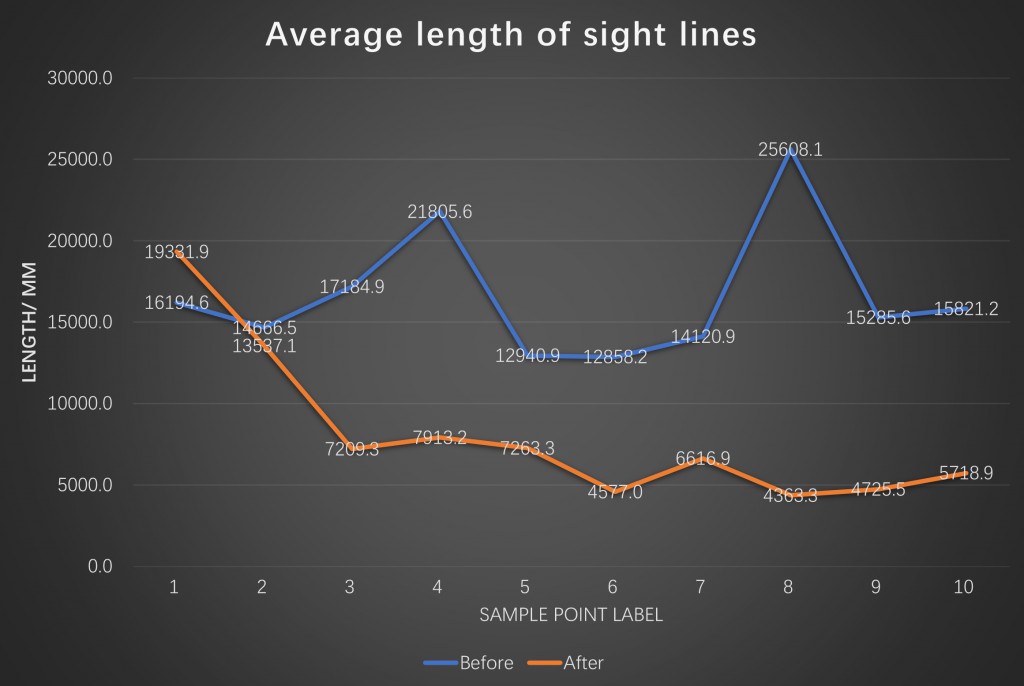
Distance between people and water is a major indicator to measure quality of the experience with water. For example, standing on a bank of Vltava River will lead to a wide range of distances, meaning a great view of magnificent landscapes. On the contrary, sitting on an edge of a little stream will lead to intensively short distances, meaning more chances to play with water.
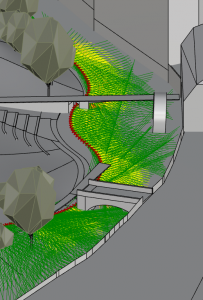
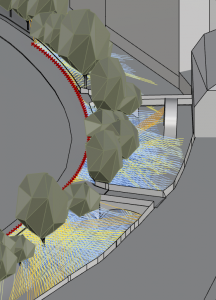
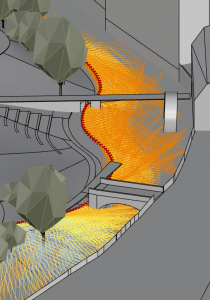
As we can see in the graphs, there’re more yellow lines in the model after design than the one before design, which means more short sight lines are created for people to have an intimate relationship with water.
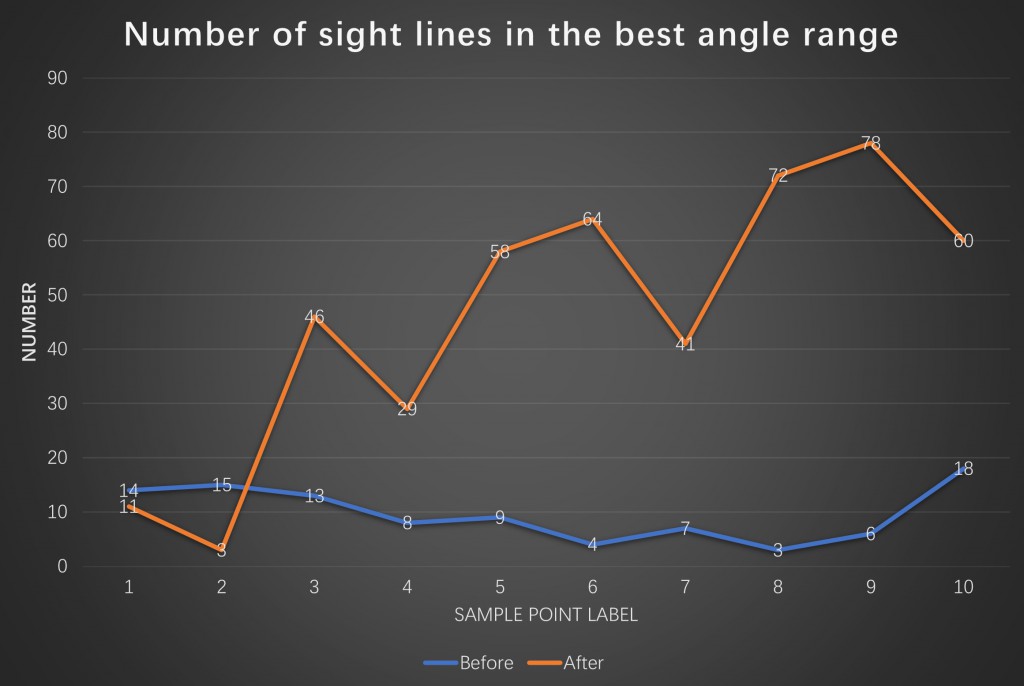
As we can see, there’re more yellow lines in the model after design than the one before design, which means more sight lines at best viewing angles are created for people to view best water scenery.
(The range of best viewing angles is from -30 degree to -10 degree)
_____________________________________________________________________________________________________________________________________
Charting
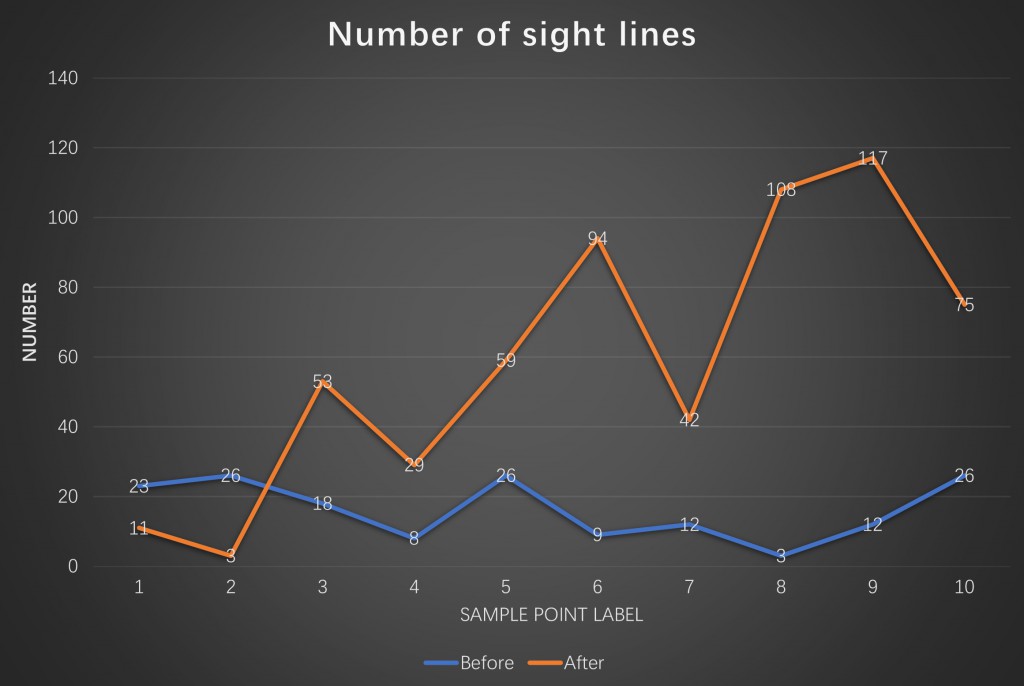
By Charting based on the data, we can easily find the improvement of the interaction with water, both in distance and viewing angles. The parametric approach makes my design more versatile and easy to support ideas using graphs, which then leads to more convincing.
____________________________________________________________________________________________________________________________________
File download link: isovist ray_ Chi
Thanks to
lunchbox: https://www.food4rhino.com/app/lunchbox
sight angle knowledge: https://zhuanlan.zhihu.com/p/28138243
one way to uniform distribution: http://www.xuexiniu.com/forum.php?mod=viewthread&tid=26177
-The end-

